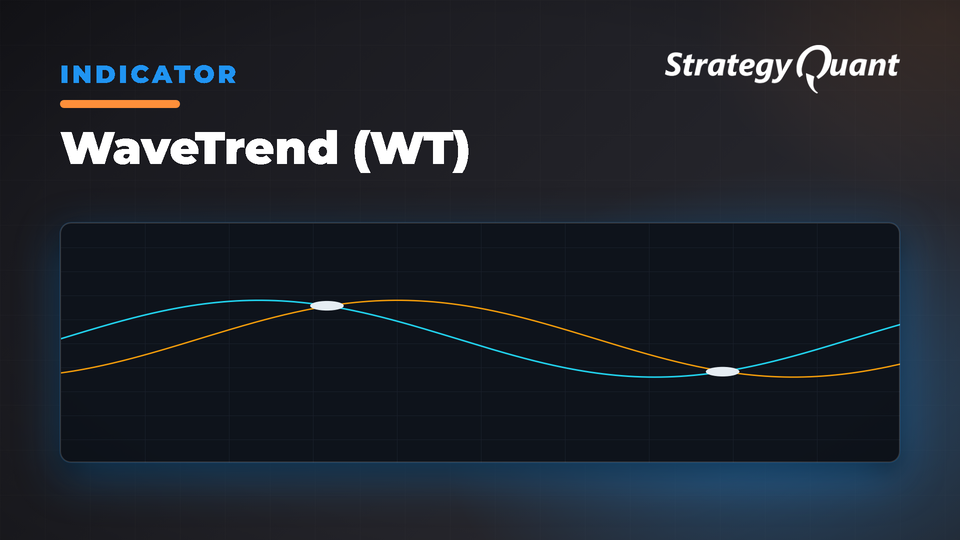
Momentum indicator with WT1/WT2 lines generating entry/exit signals through crossovers and divergences, using multi-stage smoothing to filter noise and identify trend reversals.
The dual-line structure (WT1 and WT2) generates high-probability entry and exit signals when these lines cross, filtering noise from other momentum indicators.
How WaveTrend Works
Calculation Steps:
1. Average Price (AP): HLC3 = (High + Low + Close) / 3
2. ESA (Exponential Smoothed Average): Exponential smoothing of average price
3. D (Deviation): Smoothed absolute difference between AP and ESA
4. CI (Channel Index): (AP – ESA) / (0.015 × D), similar to CCI methodology
5. WT1 (TCI): Exponentially smooths CI using Average Length parameter
6. WT2: 4-period exponential moving average of WT1
The 0.015 constant normalizes values to -80/+80 range typically.
Detection Logic:
Bullish: WT1 crosses above WT2 (buy signal); both cross above -60 (oversold exit); WT1 above +50 (strong momentum); bullish divergence (price lower low, WT1 higher low).
Bearish: WT1 crosses below WT2 (sell signal); both cross below +60 (overbought exit); WT1 below -50 (strong momentum); bearish divergence (price higher high, WT1 lower high).
Neutral: Lines between -40/+40 (consolidation); frequent small crosses (choppy); parallel movement (continuation).
Parameters & Configurations
ChannelLength (Default: 10) – Smoothing period for ESA and deviation. Range: 2-200. Lower = more sensitive; higher = smoother with reduced noise.
AverageLength (Default: 21) – Smoothing period for WT1. Range: 2-200. Shorter = reactive; longer = emphasizes major shifts.
Preset Configurations:
• Standard: ChannelLength=10, AverageLength=21
• Aggressive: ChannelLength=9, AverageLength=12
• Conservative: ChannelLength=14, AverageLength=21
Trading Applications
Crossover signals: Enter long when WT1 crosses above WT2; short on crosses below WT2. Most reliable in extreme territory (-60 to -80 bullish, +60 to +80 bearish).
Divergence patterns: Bullish divergence (price new low, WT1 higher low) and bearish divergence (price new high, WT1 lower high) precede reversals at support/resistance levels.
Multi-timeframe analysis: Use higher timeframe for trend direction; trade lower timeframe signals aligned with higher timeframe bias.
Extreme zones: WT1 above +60 indicates potential reversal; below -60 indicates oversold bounce potential. Use as alerts, not automatic reversals during strong trends.
Zero line: Both lines crossing above/below zero confirms momentum shift. Trade long above zero, short below.
Best Practices
Match parameters to timeframe: volatile crypto needs ChannelLength 12-15; stable forex uses standard parameters. Day traders use aggressive setup (9,12); swing traders use conservative (14,21).
Wait for signal confirmation—best crossovers show decisive WT1 separation from WT2.
Track divergences systematically. Regular divergences at second/third support/resistance tests offer highest probability.
Grade signals by zone: extreme zone crossovers carry higher probability than mid-range. Combine with volume analysis—highest probability when extreme zone signals occur at key levels with expanding volume.
Indicator Availability
This indicator is implemented for StrategyQuant X and available across MT4, MT5, TradeStation, and MultiCharts.
Using Custom Blocks for Conditions
Define custom conditions in StrategyQuant X using Custom Blocks. For details:
• StrategyQuant Documentation: Strategy Templates & Custom Blocks
Importing Custom Indicators into SQX
• Import & Export Custom Indicators and Other Snippets
I'm Ivan Hudec — I built the free blocks you're using here. Learn more at algotrading.space. Need something built? Work with me.