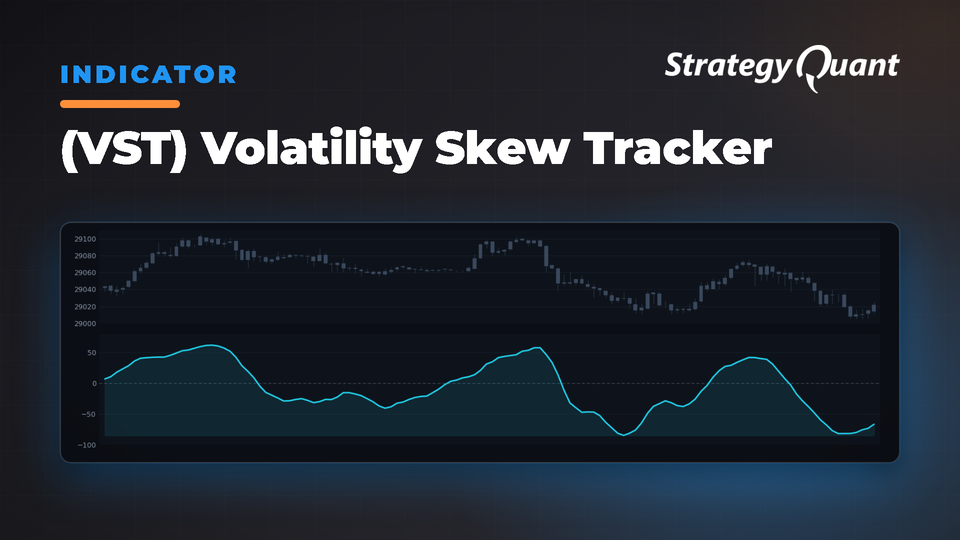
Oscillator measuring asymmetry between upside and downside volatility to detect hidden market sentiment. Useful for early trend detection, divergence analysis, and signal confirmation.
Volatility Skew Tracker (VST)
VST is an oscillator measuring asymmetry between upside and downside price volatility. Unlike conventional indicators, it analyzes the internal structure of price movements to detect bullish or bearish pressure and provide early insights into trend changes.
Volatility Skew Concept
Markets display asymmetric volatility patterns:
• Bullish Skew: Upside volatility exceeds downside volatility
• Bearish Skew: Downside volatility dominates
• Neutral Skew: Balanced volatility
VST quantifies this by comparing upside moves (high minus open) to downside moves (open minus low), factoring in closing price position.
How VST Works
1. Separates price movements into upside and downside components
2. Uses closing price position to weight move importance
3. Normalizes using ATR to adjust for overall market volatility
4. Applies moving average smoothing to reduce noise
The oscillator ranges from -100 (maximum bearish skew) to +100 (maximum bullish skew), with zero representing balanced volatility.
Implementing VST in StrategyQuant
VST accepts two primary parameters:
• LookbackPeriod: Period for calculating volatility skew (commonly 14, 21, or 34)
• SmoothingPeriod: Period for smoothing raw skew values (typically 5, 8, or 13)
Pre-configured parameter sets:
• LookbackPeriod=14, SmoothingPeriod=5 (responsive, shorter timeframes)
• LookbackPeriod=21, SmoothingPeriod=8 (balanced approach)
• LookbackPeriod=34, SmoothingPeriod=13 (less noise, longer timeframes)
Trading Strategies Using VST
Zero-Line Crossovers
Generate signals when VST crosses zero, indicating a shift from bullish to bearish skew.
Divergence Strategy
Identify divergences between VST and price—higher price highs with lower VST highs (bearish) or lower price lows with higher VST lows (bullish).
Extremes
Extreme VST readings (above +70 or below -70) often precede consolidation or reversal.
Trend Confirmation
Consistent positive VST during uptrends or negative readings during downtrends confirm solid momentum.
Volatility Breakouts
Combine VST with volatility breakout strategies. Strong directional bias with expanding volatility suggests sustainable breakouts.
Optimizing VST Parameters for Different Markets
• Forex: Shorter lookback periods (14-21)
• Stock Indices: Medium periods (21-34)
• Commodities: Longer periods (34+)
• Cryptocurrencies: Shorter periods (10-14)
Smoothing period should be approximately 1/3 to 1/4 of the lookback period for balanced sensitivity.
VST Compared to Other Indicators
• VST vs. RSI: RSI measures momentum; VST analyzes volatility structure. They complement each other.
• VST vs. ATR: ATR measures magnitude without directional bias; VST analyzes directional skew.
• VST vs. MACD: MACD identifies momentum; VST examines price movement quality through volatility structure.
Indicator Availability
Available for MT4, MT5, TradeStation, and MultiCharts.
Using Custom Blocks
Define custom conditions in StrategyQuant X using Custom Blocks to fine-tune indicator parameters:
• Custom Blocks Documentation
• Strategy Templates & Custom Blocks
• Custom Blocks YouTube Tutorial
Importing Custom Indicators
To import custom indicators into StrategyQuant X: Import & Export Custom Indicators and Other Snippets
I'm Ivan Hudec (clonex), builder of the free blocks here. Learn more at algotrading.space or work with me.