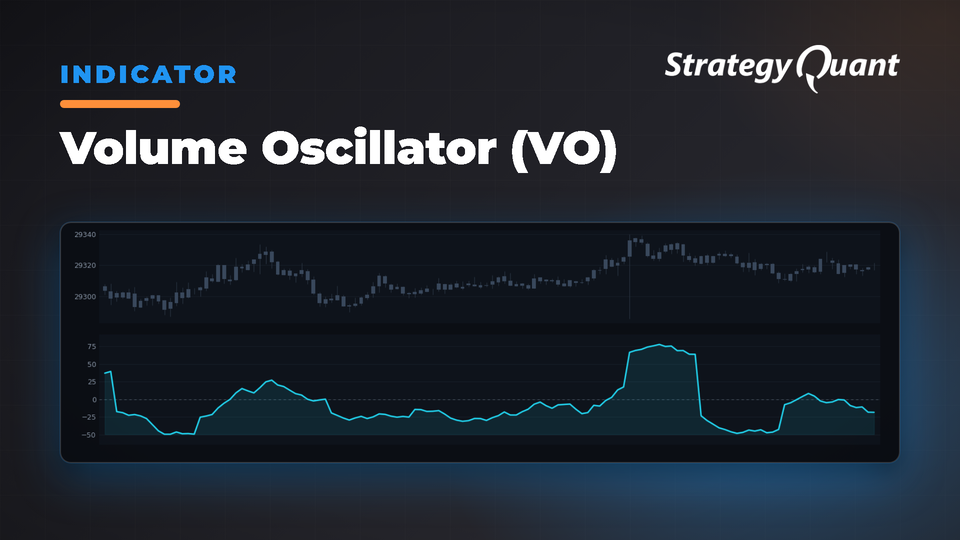
Measures volume momentum by comparing fast and slow volume moving averages, ranging from -100 to +100. Confirms price moves with volume conviction and identifies divergences revealing accumulation or distribution.
The Volume Oscillator (VO) measures volume momentum using a percentage-based calculation that normalizes volume data across different instruments and timeframes. Positive VO readings indicate expanding participation, while negative readings suggest declining conviction and exhaustion.
How VO Works
The indicator calculates the percentage difference between fast and slow volume moving averages:
VO = ((Short Volume MA – Long Volume MA) / Long Volume MA) × 100
For each bar:
1. Calculate Simple Moving Average of volume over the short period
2. Calculate Simple Moving Average of volume over the long period
3. Determine the percentage difference between these two averages
4. Produce a value between -100 and +100
Detection Logic:
Rising Volume Momentum (Positive VO):
• VO above zero: Short-term volume exceeding long-term average
• VO crossing above zero: Volume momentum shifting bullish
• VO above +50: Exceptional volume expansion, strong institutional participation
Declining Volume Momentum (Negative VO):
• VO below zero: Short-term volume below long-term average
• VO crossing below zero: Volume momentum shifting bearish
• VO below -50: Significant volume contraction, potential exhaustion
Signal Patterns:
• Price breaks resistance with VO rising: Valid breakout with conviction
• Price breaks support with VO rising: Strong selling pressure
• Price new high with VO declining: Bearish divergence
• Price higher high while VO lower high: Distribution pattern
• Price lower low while VO higher low: Accumulation pattern
Parameters & Configurations
ShortPeriod (Default: 12) – Controls the fast volume moving average. Range: 2-100. Lower values increase sensitivity but may produce more noise.
LongPeriod (Default: 26) – Sets the slow volume moving average. Range: 5-200. Higher values provide stable reference levels but reduce responsiveness.
Preset Configurations:
• Standard Setup: ShortPeriod=12, LongPeriod=26
• Aggressive Setup: ShortPeriod=9, LongPeriod=21
• Conservative Setup: ShortPeriod=14, LongPeriod=28
• Intermediate Setup: ShortPeriod=10, LongPeriod=20
• Scalping Setup: ShortPeriod=5, LongPeriod=10
• Position Trading Setup: ShortPeriod=20, LongPeriod=50
Trading Applications
Confirm breakouts: Rising VO above +40 indicates genuine institutional interest. Identify smart money accumulation: Price lower low but VO higher low during downtrends. Use price action analysis: Combine with key structural levels. Zero line crossovers: Signal momentum shifts. Detect climactic moves: VO extremes (+70 or above after rallies, or -70 or below during selloffs) often precede reversals.
Best Practices
Match period parameters to your trading timeframe and market volatility. Validate price action with volume momentum rather than trading VO in isolation. Implement divergence analysis systematically—bullish divergence (price lower low, VO higher low) offers high probability reversal signals at support. Use threshold levels: -20 to +20 = normal fluctuation, +20 to +50 = moderate momentum, above +50 or below -50 = exceptional events. Combine VO with price-based indicators (RSI, MACD) for comprehensive analysis.
Indicator Availability
This indicator is implemented for StrategyQuant X and can be used across all supported trading platforms including MT4, MT5, TradeStation, and MultiCharts.
Using Custom Blocks for Conditions
Define custom conditions in StrategyQuant X using Custom Blocks. For more information:
• StrategyQuant Documentation: Strategy Templates & Custom Blocks
Importing Custom Indicators into SQX
• Import & Export Custom Indicators and Other Snippets
You know me as clonex. I'm Ivan Hudec — I built the free blocks you're using here, and I write about the research behind them at algotrading.space. Need something built? Work with me.