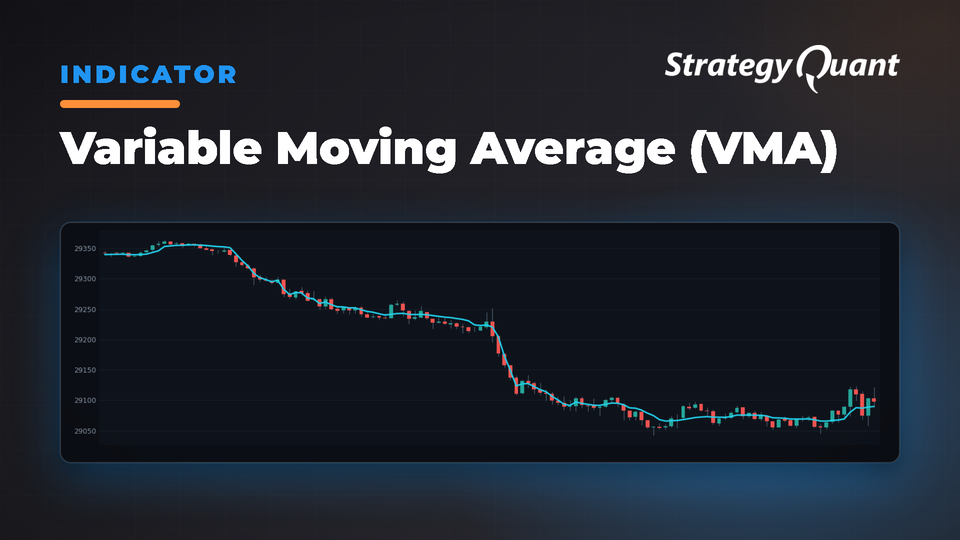
Adaptive moving average that measures price efficiency to automatically respond to market conditions—faster in trends, slower in choppy markets. Reduces lag and false signals across all trading environments.
The Variable Moving Average (VMA) is an adaptive moving average developed by Tushar Chande that responds to price efficiency—how effectively price moves in a direction relative to its volatility. This allows the VMA to become more responsive during strong trends and less sensitive during choppy conditions.
The Concept of Price Efficiency
The VMA quantifies efficiency by comparing net directional movement to the total path traveled. This ratio, called the Efficiency Ratio (ER), ranges from 0 to 1:
• Values near 1 indicate highly efficient, trending price movement
• Values near 0 indicate choppy, range-bound conditions
How VMA Works
1. Efficiency Calculation: Divides the magnitude of net price change by the sum of all absolute price changes
2. Dynamic Smoothing: Uses efficiency to determine a custom smoothing factor between fast and slow extremes
3. Volatility Factor: The VolFactor parameter adjusts sensitivity to efficiency changes
4. Adaptive Response: Behaves like a fast moving average during trends, slow during consolidations
The Mathematics Behind VMA
1. Calculate Price Direction (Net Change):
   netChange = |Price(today) - Price(Period days ago)|
2. Calculate Total Volatility:
   totalVolatility = Sum of |Price(day i) - Price(day i+1)| for Period days
3. Calculate Efficiency Ratio (ER):
   ER = netChange / totalVolatility (ranges from 0 to 1)
4. Determine Smoothing Constant:
   SC = ER² * VolFactor, scaled between fast and slow EMA constants
5. Calculate VMA:
   VMA(today) = alpha * Price(today) + (1 - alpha) * VMA(yesterday)
Why Use VMA in Your Trading Systems?
• Automatic Adaptation: Responds appropriately to both trending and ranging markets
• Reduced Lag in Trends: More responsive during strong directional moves
• Fewer False Signals: Less sensitive during choppy market conditions
• Volatility Awareness: Distinguishes meaningful from noisy price movements
• Customizable Sensitivity: VolFactor parameter allows fine-tuning
Implementing VMA in StrategyQuant
The indicator accepts two parameters:
• Period: The lookback period for calculating efficiency (commonly 9, 14, 20, 50, or 200)
• VolFactor: Controls the sensitivity of adaptation (default is 2)
Pre-configured parameter sets:
• Period=9, VolFactor=2
• Period=14, VolFactor=2
• Period=20, VolFactor=2
• Period=50, VolFactor=2
• Period=200, VolFactor=2
• Period=14, VolFactor=4 (more responsive)
• Period=14, VolFactor=1 (less responsive)
Trading Strategies Using VMA
1. VMA Crossover Systems
Use two VMA lines with different periods (e.g., VMA(14) and VMA(50)) to generate entry and exit signals.
2. VMA Trend Direction
The slope of the VMA indicates trend strength and direction. A steepening slope indicates increasing momentum.
3. VMA Support and Resistance
During trends, VMA functions as dynamic support in uptrends or resistance in downtrends. Price pullbacks offer entry opportunities.
4. VMA with Price Patterns
Combine VMA with chart patterns to confirm whether the underlying trend supports the pattern's expected resolution.
5. Multi-Timeframe VMA Analysis
Apply VMA across different timeframes to identify alignment between short, intermediate, and long-term trends.
Optimizing VMA Parameters for Different Markets
• Period Selection:
– Shorter periods (9-14): Short-term trading
– Medium periods (20-50): Swing trading
– Longer periods (200+): Position trading and major trend identification
• VolFactor Adjustment:
– Higher values (3-5): Increase responsiveness, better for volatile markets
– Lower values (0.5-1.5): Decrease responsiveness, better for stable instruments
– Default (2): Balanced approach
VMA vs. VIDYA: Understanding the Differences
• VMA adapts based on price efficiency (directional movement relative to volatility)
• VIDYA adapts based on the Chande Momentum Oscillator (measures momentum strength)
VMA excels at identifying persistent trends while filtering noise; VIDYA is more responsive to shorter-term momentum shifts.
Indicator Availability:
This indicator is implemented for MT4, MT5, TradeStation, and MultiCharts.
Using Custom Blocks for Conditions:
Define your own conditions in StrategyQuant X using Custom Blocks to fine-tune the indicator. Resources:
• StrategyQuant Documentation: Custom Blocks
• StrategyQuant Documentation: Strategy Templates & Custom Blocks
• StrategyQuant YouTube Tutorial: Custom Blocks Overview
Importing Custom Indicators into SQX:
Import & Export Custom Indicators and Other Snippets
You know me as clonex. I'm Ivan Hudec — I built the free blocks you're using here, and I write about the research behind them at algotrading.space. Need something built? Work with me.