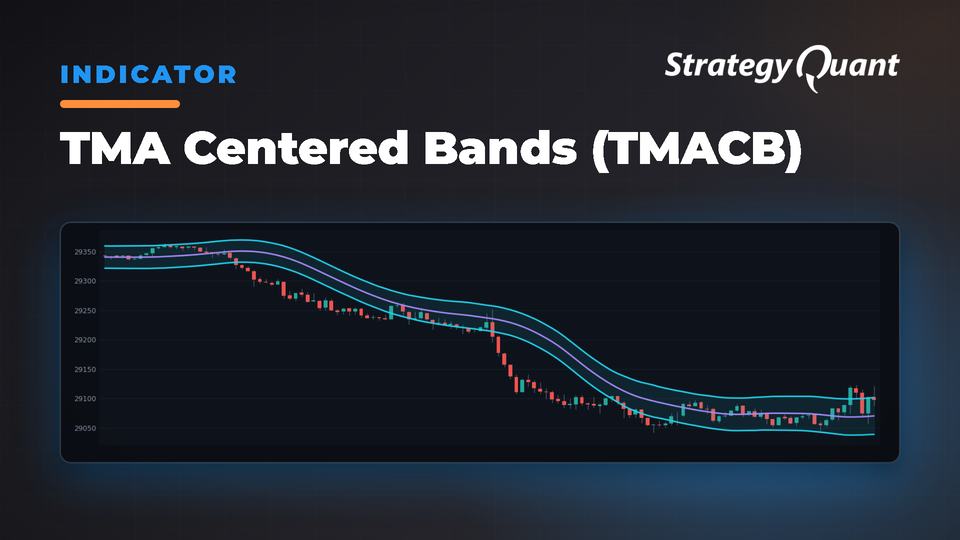
Smooth triangular-weighted moving average with ATR bands that adapt to volatility for trend trading and breakout signals. Non-repainting design ensures reliability for backtesting and live trading.
TMA Centered Bands Indicator
Triangular Weighting The indicator applies triangular weighting to price data with maximum weight at the center point and progressively less weight for bars further away. This creates an exceptionally smooth moving average that filters market noise more effectively than traditional moving averages.
Non-Repainting Design Values are calculated at a position HalfLength bars ago using only historical data. This guarantees values never change once calculated, making it perfect for backtesting and automated trading systems.
Volatility-Adaptive Bands ATR-based bands automatically expand during volatile market conditions and contract during quiet periods, helping identify meaningful breakouts versus normal price fluctuations.
Parameters
HalfLength (default: 12, range: 1-500) Determines smoothing period and centering offset. Smaller values make the indicator more responsive; larger values provide smoother signals with more lag.
AtrPeriod (default: 100, range: 1-1000) Lookback period for Average True Range calculation. Longer periods provide stable volatility measurements; shorter periods make bands more reactive to recent spikes.
AtrMultiplier (default: 2.0, range: 0.1-10.0) Controls band width. Higher multipliers create wider bands; lower multipliers create tighter bands for more frequent signals.
Preset Parameter Sets
• Standard: HalfLength=12, AtrPeriod=100, AtrMultiplier=2.0
• Slower: HalfLength=24, AtrPeriod=100, AtrMultiplier=2.0
• Tighter: HalfLength=12, AtrPeriod=50, AtrMultiplier=1.5
• Wider: HalfLength=12, AtrPeriod=100, AtrMultiplier=2.5
How to Use
Trend Identification
• Price above Upper band: Strong uptrend
• Price between Middle and Upper: Uptrend
• Price near Middle: Neutral/consolidation
• Price between Lower and Middle: Downtrend
• Price below Lower band: Strong downtrend
Entry Signals
• Long entries when price crosses above Middle line from below
• Short entries when price crosses below Middle line from above
• Breakout longs when price closes above Upper band
• Breakout shorts when price closes below Lower band
Exit Signals
• Exit longs when price crosses below Middle or touches Lower band
• Exit shorts when price crosses above Middle or touches Upper band
Implementation Notes
Requires minimum of 2 × HalfLength + AtrPeriod + 10 bars. With default settings, at least 134 bars of historical data are needed.
Price calculation: (High + Low + Close + Close) / 4
TMA Centered Bands - Custom Trading Blocks
This package contains 8 ready-to-use condition blocks for systematic strategy building.
Band Penetration Blocks
HighAboveTMAU (Opposite: LowBelowTMAD)
• Logic: High[1] > TMAUpper[1]
• Use Case: Long entry on breakout, or short exit signal
LowBelowTMAD (Opposite: HighAboveTMAU)
• Logic: Low[1] < TMALower[1]
• Use Case: Short entry on breakdown, or long exit signal
Mean Reversion Blocks
HighAboveTMAD (Opposite: LowBelowTMAU)
• Logic: Low[2] < TMALower[2] AND High[1] > TMALower[1]
• Use Case: Long entry after successful test of support at lower band
LowBelowTMAU (Opposite: HighAboveTMAD)
• Logic: High[2] > TMAUpper[2] AND Low[1] < TMAUpper[1]
• Use Case: Short entry after failed breakout at upper band
Trend Direction Blocks
TMACIsRising (Opposite: TMACIsFalling)
• Logic: TMAMiddle[0] > TMAMiddle[1]
• Use Case: Filter for long-only strategies, trend confirmation
TMACIsFalling (Opposite: TMACIsRising)
• Logic: TMAMiddle[0] < TMAMiddle[1]
• Use Case: Filter for short-only strategies, trend confirmation
Advanced Rebound Signals
TMACReboundUP (Opposite: TMACReboundDown)
• Logic: Low[2] < TMAMiddle[2] AND Close[2] < Open[2] AND Close[1] > Open[1]
• Use Case: Long entry when price exhausts after testing middle line support
TMACReboundDown (Opposite: TMACReboundUP)
• Logic: High[2] > TMAMiddle[2] AND Close[2] > Open[2] AND Close[1] < Open[1]
• Use Case: Short entry when price exhausts after testing middle line resistance
Strategy Template Examples
Trend-Following Breakout
Long Entry: HighAboveTMAU AND TMACIsRising
Long Exit: LowBelowTMAU OR TMACIsFalling
Short Entry: LowBelowTMAD AND TMACIsFalling
Short Exit: HighAboveTMAD OR TMACIsRising
Mean Reversion
Long Entry: HighAboveTMAD AND TMACIsRising
Long Exit: HighAboveTMAU
Short Entry: LowBelowTMAU AND TMACIsFalling
Short Exit: LowBelowTMAD
Rebound (Recommended)
Long Entry: TMACReboundUP AND TMACIsRising
Long Exit: TMACReboundDown OR TMACIsFalling
Short Entry: TMACReboundDown AND TMACIsFalling
Short Exit: TMACReboundUP OR TMACIsRising
Block Parameters
• Chart: Select data series
• HT_Per (HalfLength): 10-220, step 10
• ATR_Per (ATR Period): 10-120, step 10
• ATR_Mult (ATR Multiplier): 0.5-3.0, step 0.5
Indicator Availability
Implemented for StrategyQuant X across all supported trading platforms including MT4, MT5, TradeStation, and MultiCharts.
Custom Blocks and Custom Indicators
For detailed information, refer to:
• StrategyQuant Documentation: Strategy Templates & Custom Blocks
• Import & Export Custom Indicators and Other Snippets
Author: Ivan Hudec (clonex) — algotrading.space | Work with me