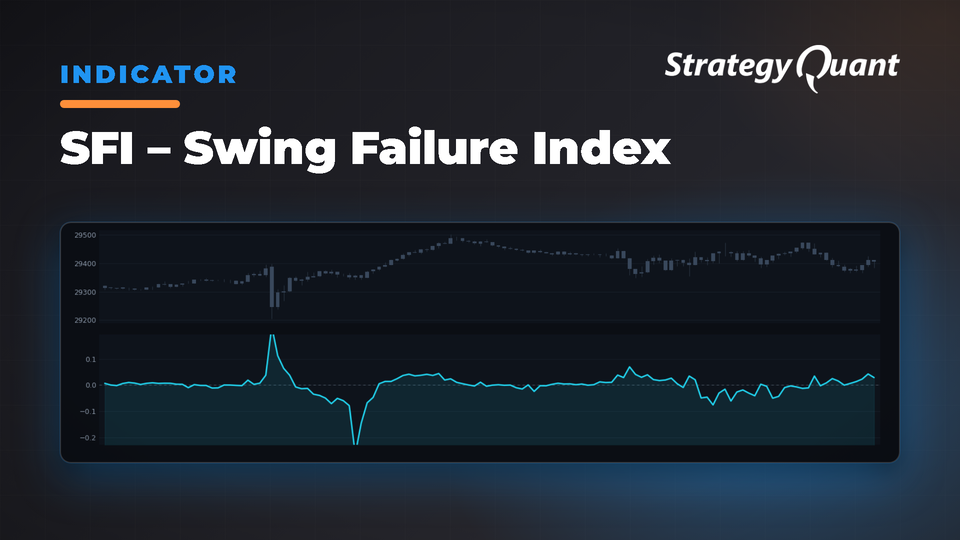
Detects momentum failures in both highs and lows to identify trend reversals before they appear in price action. Compares current momentum against historical averages to catch momentum shifts and exhaustion.
What Makes SFI Unique?
• Dual Momentum Analysis: Separately tracks momentum for both highs and lows
• Relative Strength Assessment: Compares current momentum against historical averages
• Failure Detection: Identifies when momentum is "failing" relative to recent performance
• Trend Reversal Focus: Specifically designed to catch momentum shifts before major trend changes
How SFI Works
Core Concept
The SFI identifies trend reversals by detecting momentum failures before they appear in price action. It tracks the rate of change in both highs and lows over a specified period and compares these to their recent averages.
Mathematical Foundation
1. Current Momentum Calculation:
– High Momentum = ((Current High – Previous High[Period]) / Previous High[Period]) × 100
– Low Momentum = ((Current Low – Previous Low[Period]) / Previous Low[Period]) × 100
2. Average Momentum Calculation:
– Average High Momentum = Sum of High Momentum values over Period / Period
– Average Low Momentum = Sum of Low Momentum values over Period / Period
3. Failure Detection:
– High Failure = Current High Momentum – Average High Momentum
– Low Failure = Current Low Momentum – Average Low Momentum
4. SFI Value:
– SFI = (High Failure – Low Failure) / 2
– Applied with smoothing: SFI = 0.7 × Current SFI + 0.3 × Previous SFI
Indicator Parameters
Period (Default: 14)
• Range: 5 to 1000
• Recommended Settings: 14, 20, 30, 50
• Effect: Shorter periods provide more sensitive signals but may generate more false signals. Longer periods provide smoother signals but may lag trend changes.
Preset Configurations
• Short-term Trading: Period = 14
• Medium-term Analysis: Period = 20, 30
• Long-term Perspective: Period = 50
Signal Interpretation
Reading SFI Values
Positive Values (+): Indicate upward momentum strength. Potential bullish conditions.
Negative Values (-): Indicate downward momentum strength. Potential bearish conditions.
Near Zero Values: Indicate momentum equilibrium or market consolidation.
Trading Signals
Bullish Signals:
• SFI crosses above zero
• Rising SFI from negative territory
• SFI making higher lows
Bearish Signals:
• SFI crosses below zero
• Falling SFI from positive territory
• SFI making lower highs
Divergence Signals:
• Bullish Divergence: Price makes lower lows while SFI makes higher lows
• Bearish Divergence: Price makes higher highs while SFI makes lower highs
Practical Trading Applications
1. Trend Reversal Detection
• Long Entry: SFI crosses above 0 with confirmation from price action
• Short Entry: SFI crosses below 0 with confirmation from price action
2. Momentum Confirmation
• Trend Continuation: SFI remains positive during uptrends, negative during downtrends
• Momentum Weakening: SFI approaching zero warns of potential trend exhaustion
3. Overbought/Oversold Conditions
• Extreme Positive Values (>50): Potentially overbought conditions
• Extreme Negative Values (<-50): Potentially oversold conditions
Best Practices
Timeframe Considerations
• Intraday Trading: Period = 14
• Daily Charts: Period = 20 or 30
• Weekly Charts: Period = 50
Confirmation Techniques
Combine SFI signals with price action, volume, and other indicators like moving averages, RSI, or MACD.
Risk Management
• Place stops beyond recent swing points
• Reduce size when SFI signals are weak or conflicting
• Consider overall market conditions and volatility
Common Pitfalls to Avoid
1. Not all zero-line crossovers lead to significant moves
2. SFI works best in trending markets; may whipsaw in sideways markets
3. Always seek confirmation before entering trades
4. Match the Period setting to your trading timeframe
Advanced Techniques
• Multi-Timeframe Analysis: Use higher timeframe SFI for trend direction, lower timeframe for entry timing
• Divergence Patterns: Monitor SFI divergences combined with other momentum divergences
• Volatility Adjustments: Increase Period during high volatility, reduce during low volatility
Indicator Availability: Implemented for MT4, MT5, TradeStation, and MultiCharts.
Using Custom Blocks for Conditions: Define your own conditions in StrategyQuant X using Custom Blocks.
• StrategyQuant Documentation: Custom Blocks
• StrategyQuant Documentation: Strategy Templates & Custom Blocks
• StrategyQuant YouTube Tutorial: Custom Blocks Overview
Importing Custom Indicators into SQX:
Import & Export Custom Indicators and Other Snippets
Author: Ivan Hudec (clonex) — algotrading.space | Work with me