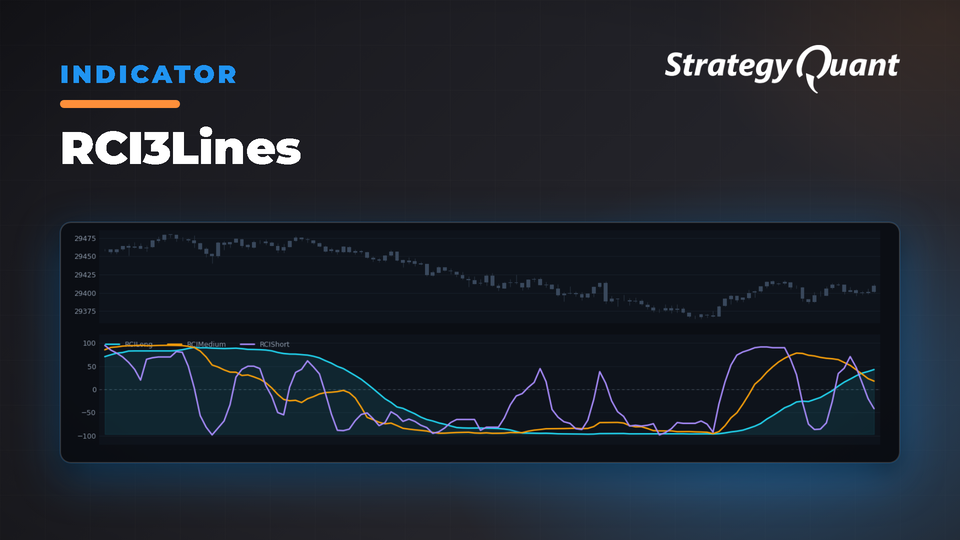
Three-line Rank Correlation Index that identifies momentum shifts and trend reversals through multi-timeframe confirmation. Excels at filtering false signals and detecting reversals in ranging markets.
The three-line structure allows traders to distinguish between temporary fluctuations and sustained directional moves. When all three lines converge in the same direction, it signals strong institutional consensus across multiple timeframes. This makes RCI3 particularly effective at filtering out false signals that plague single-period oscillators.
How RCI3 Works
The indicator calculates the Rank Correlation Index for three distinct periods using Spearman's rank correlation coefficient formula:
RCI = (1 – 6 × Σ(d²) / (n × (n² – 1))) × 100
Where:
• d = difference between price rank and time rank
• n = period length
For each bar, the indicator:
1. Collects price data over the specified period
2. Assigns ranks to prices (1 = highest, n = lowest)
3. Assigns time ranks (1 = most recent, n = oldest)
4. Calculates the sum of squared differences between price and time ranks
5. Applies the Spearman formula to produce a value between -100 and +100
Detection Logic:
Bullish Momentum: RCI approaching +100, all three lines above zero, short line crossing above medium/long lines (indicates acceleration of upward momentum).
Bearish Momentum: RCI approaching -100, all three lines below zero, short line crossing below medium/long lines (indicates acceleration of downward momentum).
Divergence Signals: Price makes new high but RCI makes lower high (bearish), or price makes new low but RCI makes higher low (bullish).
Overbought (+80 to +100) and oversold (-80 to -100) zones should be used contextually rather than mechanically.
Parameters & Configurations
ShortPeriod (Default: 9) – Controls the fast RCI line for capturing immediate momentum shifts. Range: 3-100. Lower values increase sensitivity to recent price action but may generate more whipsaws.
MediumPeriod (Default: 26) – Sets the intermediate RCI line for identifying developing trends. Range: 10-200. This period acts as a filter between short-term noise and long-term direction.
LongPeriod (Default: 52) – Defines the slow RCI line for confirming major trend direction. Range: 20-500. Higher values provide more stable signals but lag current price action.
Preset Configurations:
• Standard Japanese Setup: ShortPeriod=9, MediumPeriod=26, LongPeriod=52 (traditional Japanese technical analysis ratios)
• Aggressive Setup: ShortPeriod=9, MediumPeriod=21, LongPeriod=42 (faster response to momentum changes)
• Conservative Setup: ShortPeriod=12, MediumPeriod=26, LongPeriod=52 (reduced sensitivity to noise)
• Extended Setup: ShortPeriod=14, MediumPeriod=28, LongPeriod=56 (swing trading orientation)
Trading Applications
Identify triple confirmation signals when all three lines align above or below the zero line, indicating strong institutional participation and sustained directional moves.
Spot momentum reversals when the short-period line diverges from price action while medium and long lines remain opposite, creating early warning signals before trend exhaustion becomes obvious.
Combine RCI3 with higher timeframe structure analysis. Look for oversold readings (-80 or below) near support for long entries, and overbought readings (+80 or above) near resistance for short opportunities. RCI is particularly effective during ranging markets where traditional momentum indicators produce unreliable signals.
Zero line crossovers provide clean trend change signals when multiple lines cross simultaneously. Bullish signal: short line crosses above zero followed by medium line, with long line confirming. Reverse applies for bearish signals.
Best Practices
Match parameters to your trading timeframe. For cryptocurrency and volatile forex pairs, increase all periods by 20-30%. For stable equity indices, standard parameters work well. Day traders should focus on shorter periods (Short=5-7, Medium=15-21, Long=30-42), while position traders benefit from extended periods.
Always wait for multi-line confirmation before significant positions. Most reliable setups occur when the short line reaches an extreme first, followed by the medium line, indicating building momentum rather than exhaustion.
Implement divergence analysis systematically. Regular divergences (price and RCI moving opposite directions) offer the highest probability reversal signals, particularly at support/resistance levels. Hidden divergences work best during strong trends for pullback entry opportunities.
Use the RCI ladder pattern for position scaling. When all three lines move from below -80 to above +80 (or vice versa) in sequence, add to positions as each line crosses key thresholds. Exit when the first line shows reversal behavior.
Indicator Availability
This indicator is implemented for StrategyQuant X and can be used across all supported trading platforms including MT4, MT5, TradeStation, and MultiCharts.
Using Custom Blocks for Conditions
Define your own conditions in StrategyQuant X using Custom Blocks to set up parameters such as periods or thresholds:
• StrategyQuant Documentation: Strategy Templates & Custom Blocks
Importing Custom Indicators into SQX
To import custom indicators into StrategyQuant X:
• Import & Export Custom Indicators and Other Snippets
I'm Ivan Hudec (clonex) – I built the free blocks you're using here and write about the research at algotrading.space. Work with me.