StrategyQuant
Q AI AssistantAlgoCloudQuantAnalyzerQuantDataManager
Free CourseCompany
BlogDocumentationForumContact us
BlogMarketplace
Log in
Create free account

Product

  • Pricing & licenses
  • Learn
  • Marketplace
  • Start free trial

Legal

  • Terms of Service
  • Privacy Policy
  • Cookies

Contact

[email protected]

Company

StrategyQuant s.r.o.

Korunní 2569/108, Vinohrady, 101 00 Praha 10, Czech Republic, EU

IČ: 04000498

DIČ: CZ04000498

Social

  • Legal Notice | PROCESSING AND PROTECTION OF PERSONAL DATA

    Past performance is no guarantee of future success. All information should be viewed as educational only

    UNITED STATES Disclaimer required by Government - Commodity Futures Trading Commission informs: Futures and options trading have great potential rewards, but also great potential risk. You must be aware of the risks and be willing to accept them in order to invest in the futures and options markets. Don't trade with money you can't afford to lose. This is neither a solicitation nor an offer to buy/sell futures, shares or options on the same. No representation is being made that any account will or is likely to realise profits or losses similar to those discussed in this document. The past performance of any trading system or methodology is not necessarily indicative of future results.

    CFTC RULE 4.41 - HYPOTHETICAL OR SIMULATED PERFORMANCE RESULTS HAVE CERTAIN LIMITATIONS. UNLIKE A RECORD OF ACTUAL PERFORMANCE, SIMULATED RESULTS DO NOT REPRESENT ACTUAL TRADING. ALSO, SINCE THE TRADES WERE NOT EXECUTED, THE RESULTS MAY HAVE OFFSET THE IMPACT, IF ANY, OF CERTAIN MARKET FACTORS, SUCH AS LACK OF LIQUIDITY. SIMULATED TRADING PROGRAMMES IN GENERAL ARE ALSO SUBJECT TO THE FACT THAT THEY ARE DESIGNED WITH THE BENEFIT OF HINDSIGHT. NO REPRESENTATION IS BEING MADE THAT ANY ACCOUNT WILL OR IS LIKELY TO REALISE PROFITS OR LOSSES SIMILAR TO THOSE SHOWN.

    NO REPRESENTATION IS BEING MADE THAT ANY ACCOUNT WILL, OR IS LIKELY TO, REALISE PROFITS OR LOSSES SIMILAR TO THOSE DISCUSSED WITHIN THIS SITE. IF YOU DECIDE TO INVEST REAL MONEY, ALL TRADING DECISIONS IN THE FINANCIAL MARKETS SHOULD BE YOUR OWN.

    © StrategyQuant 2026

    Powered by Klaudie.ai

    Back to marketplaceDIGITAL

    Portfolio TimeMap

    StrategyQuantResult Plugins
    Portfolio TimeMap

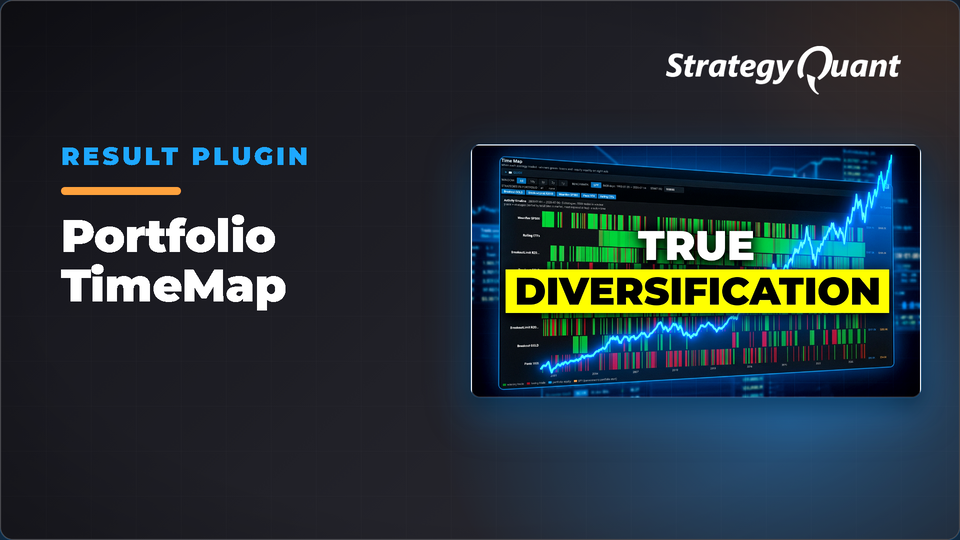
    Heat map visualization showing when portfolio strategies trade and profitability. Instantly reveal correlation patterns and whether strategies are diversified without re-backtesting.

    Most performance analytics answer one question: how good is this strategy? Net profit, profit factor, drawdown, Sharpe — all of it collapses a strategy’s entire life into a handful of numbers. But for a multi-strategy portfolio, there’s a second question that matters just as much and almost nothing shows you: when does each strategy actually trade?

    That’s the gap TimeMap fills. It’s a StrategyQuant X ResultsPlugin that turns your portfolio’s order history into a time map — a bird’s-eye view of who was in the market, when, and whether it worked.

    What it shows

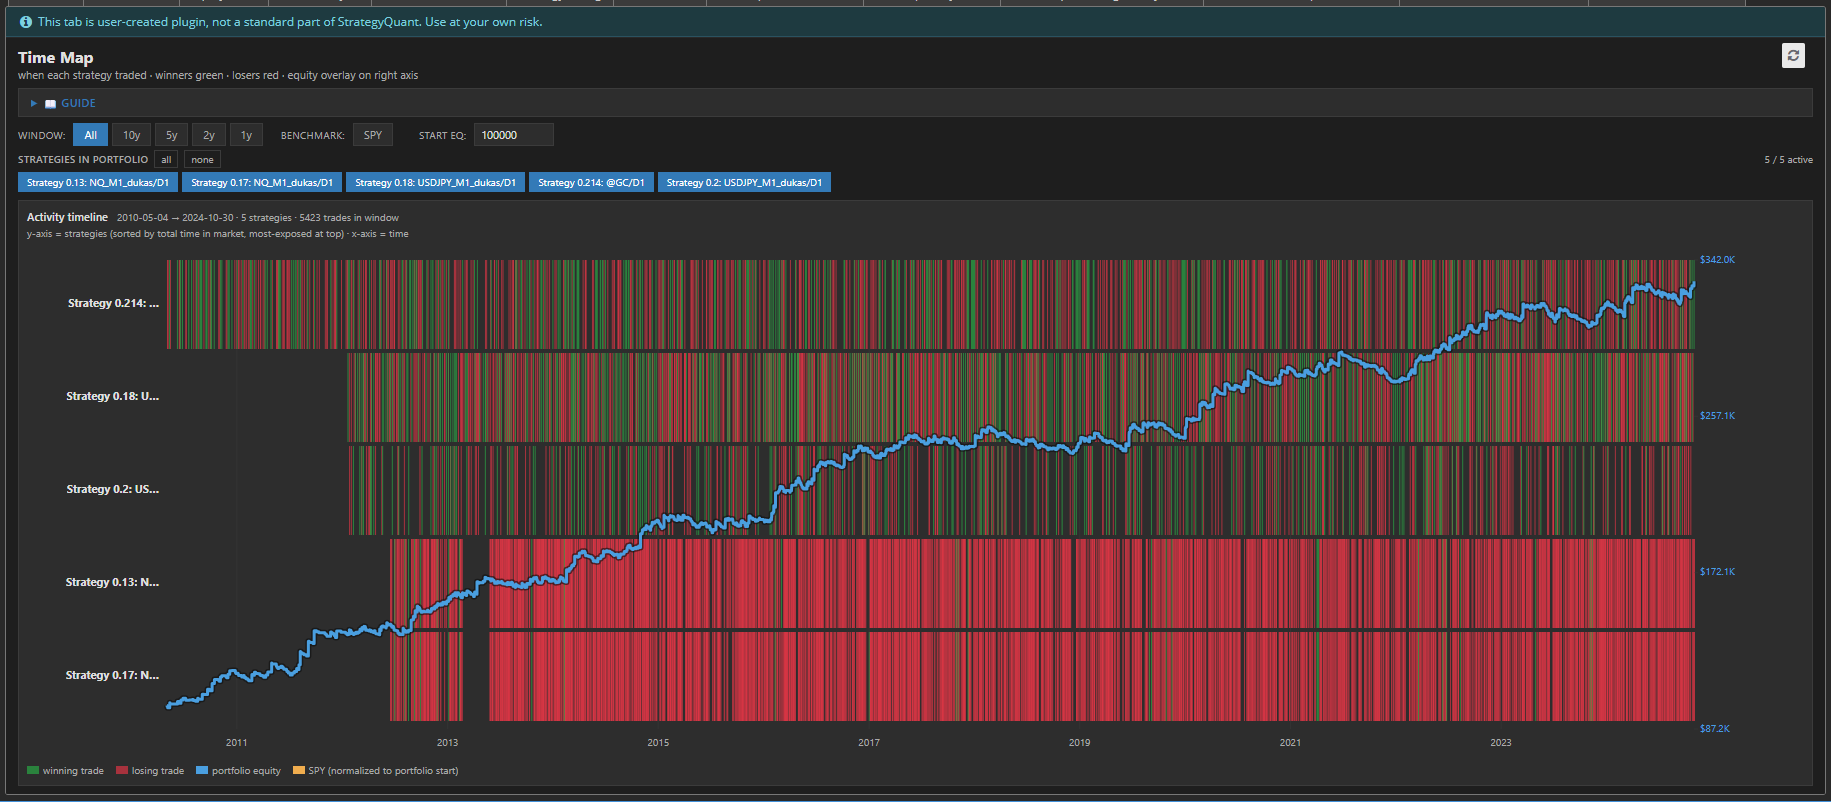
    TimeMap lays your portfolio out as a heat map over time:

    • One row per strategy, sorted by total time in market — your most-exposed strategies sit at the top.
    • Green blocks mark winning trades, red blocks mark losers, positioned exactly where they happened on the timeline.
    • A blue equity line overlays the whole thing on the right axis, so you can tie activity to portfolio value.
    • An optional orange SPY benchmark (fetched live) shows how a passive buy-and-hold would have done over the same window, normalized to your starting capital.

    At a glance you can read the shape of your portfolio’s risk — something no stats table can express.


    Why timing is the hidden risk

    Two portfolios can have identical returns and identical drawdowns and still be worlds apart in real-world risk. The difference is overlap.

    If every strategy piles into the market at the same moments, you don’t have ten strategies — you have one strategy wearing ten costumes. When that regime turns, everything drops together. TimeMap makes this instantly visible: a vertical stripe of red across every row during the same period is the classic signature of systemic, correlated risk.

    The opposite — strategies that light up at different times, filling each other’s quiet stretches — is genuine diversification. TimeMap lets you see complementary timing instead of assuming it.


    Built for exploration

    The map is interactive, and everything recomputes instantly with no re-backtest:

    • Window controls (All / 10y / 5y / 2y / 1y) zoom the time range so you can drill into a specific crisis or era.
    • Strategy chips let you toggle individual strategies on and off — the equity curve recalculates on the fly from whatever’s selected, so you can test “what if I dropped this one?” in a click.
    • Adjustable starting capital rescales the equity overlay.
    • SPY toggle drops the benchmark in or out.
    • The map scrolls vertically for large portfolios while the time and value axes stay pinned in place.


    The details that make it usable

    TimeMap is a single self-contained HTML file — no Python, no backend, no configuration. It renders crisp SVG at any resolution, supports both light and dark SQX skins, and handles portfolios with thousands of orders without choking. Losing trades are drawn first and winners layered on top, so a profitable strategy reads green even where trades overlap. Instant trades still show as thin markers so nothing disappears.


    The bottom line

    Stats tell you whether a strategy is good. TimeMap tells you whether your strategies belong together. For anyone building portfolios in StrategyQuant X, it turns an abstract worry — “are these correlated?” — into something you can simply look at and see.

    Past performance is no guarantee of future success. All information should be viewed as educational only UNITED STATES Disclaimer required by Government - Commodity Futures Trading Commission informs: Futures and options trading have great potential rewards, but also great potential risk. You must be aware of the risks and be willing to accept them in order to invest in the futures and options markets. Don't trade with money you can't afford to lose. This is neither a solicitation nor an offer to buy/sell futures, shares or options on the same. No representation is being made that any account will or is likely to realise profits or losses similar to those discussed in this document. The past performance of any trading system or methodology is not necessarily indicative of future results. CFTC RULE 4.41 - HYPOTHETICAL OR SIMULATED PERFORMANCE RESULTS HAVE CERTAIN LIMITATIONS. UNLIKE A RECORD OF ACTUAL PERFORMANCE, SIMULATED RESULTS DO NOT REPRESENT ACTUAL TRADING. ALSO, SINCE THE TRADES WERE NOT EXECUTED, THE RESULTS MAY HAVE OFFSET THE IMPACT, IF ANY, OF CERTAIN MARKET FACTORS, SUCH AS LACK OF LIQUIDITY. SIMULATED TRADING PROGRAMMES IN GENERAL ARE ALSO SUBJECT TO THE FACT THAT THEY ARE DESIGNED WITH THE BENEFIT OF HINDSIGHT. NO REPRESENTATION IS BEING MADE THAT ANY ACCOUNT WILL OR IS LIKELY TO REALISE PROFITS OR LOSSES SIMILAR TO THOSE SHOWN. NO REPRESENTATION IS BEING MADE THAT ANY ACCOUNT WILL, OR IS LIKELY TO, REALISE PROFITS OR LOSSES SIMILAR TO THOSE DISCUSSED WITHIN THIS SITE. IF YOU DECIDE TO INVEST REAL MONEY, ALL TRADING DECISIONS IN THE FINANCIAL MARKETS SHOULD BE YOUR OWN.
    Free1 download

    Files

    • ResultsPlugin-PortfolioTimeMap.sqm11 KBLocked

    Download unlocks after purchase or with an active tier.

    Details
    Version1.0.0
    PublishedOctober 19, 2026
    Last updatedNovember 2, 2026
    AppSQ
    TypeResultsPlugin
    AuthorTomas Vanek
    App version145.3058
    Codebase categoryResult Plugins