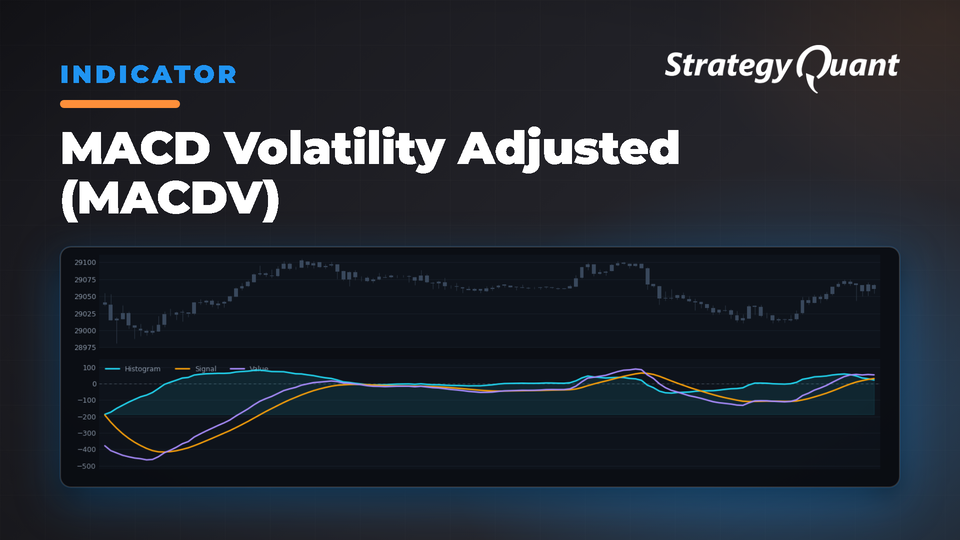
Volatility-adjusted momentum indicator that normalizes MACD by ATR for consistent signals across all market conditions. Amplifies subtle momentum in quiet markets and prevents overreaction during volatile periods.
Attribution & Intellectual Property Notice
This page provides an independent implementation of MACD-V (volatility normalised MACD), created by Alex Spiroglou (2015), presented in the research paper "MACD-V: Volatility Normalized Momentum" and awarded the NAAIM Founders Award (2022) and Charles H. Dow Award (2022).
This is an independent implementation for educational purposes, not affiliated with or endorsed by Alex Spiroglou, NAAIM, or the CMT Association.
No Investment Advice / No Warranty – For informational/educational purposes only; provided "as is" without warranties. Use at your own risk.
Reference: Alex Spiroglou (2022): MACD-V: Volatility Normalized Momentum
How MACD-V Works
MACD-V = ((Fast EMA – Slow EMA) / ATR) × 100
Signal Line = EMA of MACD-V over Signal Period
Histogram = MACD-V – Signal Line
The indicator computes the fast EMA (recent momentum), slow EMA (longer-term trend), and ATR (volatility). Dividing the EMA difference by ATR scales the result based on market volatility—high volatility produces smaller readings, low volatility produces larger readings for the same momentum difference. The result is multiplied by 100 for readability. A signal line (EMA of MACD-V) and histogram complete the indicator.
Detection Logic
Key Signal Patterns:
Momentum Confirmation: Price breaking resistance with MACD-V rising and histogram expanding confirms genuine momentum-adjusted breakouts. MACD-V won't signal on false breakouts driven by volatility spikes alone.
Divergence Analysis: Price making new highs while MACD-V forms lower highs signals momentum weakening after volatility adjustment—a reliable reversal warning.
Zero-Line Crossovers: MACD-V crossing above zero signals positive volatility-adjusted momentum; crossing below signals negative momentum.
Histogram Analysis: Expanding histogram bars confirm momentum acceleration; shrinking bars warn of deceleration and potential reversals.
Parameters & Configurations
FastPeriod (Default: 12) – EMA for recent price momentum. Range: 2–500. Lower values increase responsiveness; higher values reduce noise.
SlowPeriod (Default: 26) – EMA for longer-term trend. Range: 2–500. Higher values create more stable trends.
SignalPeriod (Default: 9) – Smoothing period for MACD-V signal line. Range: 2–500. Shorter periods generate earlier signals; longer periods filter noise.
ATRPeriod (Default: 26) – Average True Range period for volatility adjustment. Range: 2–500. Matching to slow period ensures harmonious volatility normalization.
Preset Configurations:
Standard Setup: FastPeriod=12, SlowPeriod=26, SignalPeriod=9, ATRPeriod=26 – Balanced configuration mirroring classic MACD with volatility adjustment.
Responsive Setup: FastPeriod=8, SlowPeriod=17, SignalPeriod=9, ATRPeriod=17 – Increased sensitivity for swing trading.
Aggressive Setup: FastPeriod=5, SlowPeriod=13, SignalPeriod=5, ATRPeriod=13 – Maximized responsiveness for active traders and scalpers.
Conservative Setup: FastPeriod=14, SlowPeriod=28, SignalPeriod=12, ATRPeriod=28 – Extended periods reduce false signals for position traders.
Intraday Trading Setup: FastPeriod=8, SlowPeriod=21, SignalPeriod=8, ATRPeriod=21 – Optimized for 5-minute and 15-minute charts.
Trend Following Setup: FastPeriod=16, SlowPeriod=34, SignalPeriod=11, ATRPeriod=34 – Long periods emphasize major momentum shifts.
Trading Applications
MACD-V excels at confirming breakouts by distinguishing genuine momentum expansion from volatility spikes. During range-to-trend transitions, volatility adjustment ensures signals represent momentum shifts rather than volatility artifacts. Divergence analysis becomes more reliable—when price makes new highs but MACD-V forms lower highs, momentum has truly weakened regardless of volatility regime.
Zero-line dynamics work as trend filters: MACD-V above zero confirms uptrend momentum; crossing below warns of momentum weakness. Signal line crossovers generate higher-quality entries than traditional MACD. Histogram expansion during trends shows strengthening conviction; shrinking bars warn of deceleration.
For multi-timeframe analysis, MACD-V enables consistent momentum comparison across instruments and timeframes because volatility adjustment normalizes readings.
Best Practices
Match ATR period to slow period for harmonious adjustment. Test MACD-V alongside traditional MACD to understand volatility adjustment effects. Use extreme readings strategically: in trending markets they confirm powerful trends; in ranges they mark exhaustion. Combine MACD-V with price structure for robust setups. Monitor histogram behavior around the zero line. Consider different parameter sets for different volatility regimes. Implement divergence scanning systematically—MACD-V divergence represents genuine momentum deterioration, not volatility effects.
I'm Ivan Hudec (clonex) — I built the free blocks you're using here. Learn more at algotrading.space. Work with me.