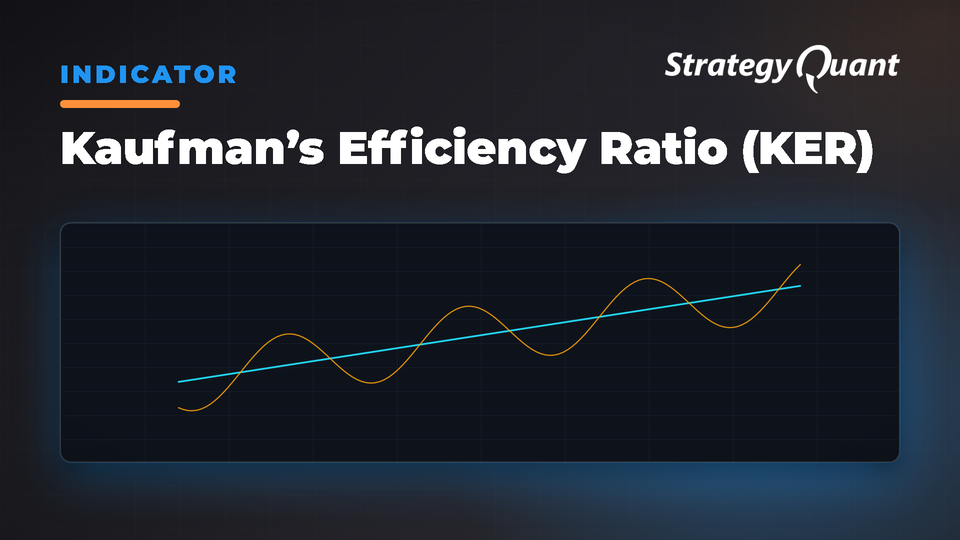
Quantifies market efficiency on a 0-to-1 scale using the ratio of net price change to total movement. Identify trending markets, filter choppy conditions, and select between trend-following or mean-reversion algorithms.
Kaufman’s Efficiency Ratio (ER)
The Efficiency Ratio (ER) was first presented by Perry Kaufman in his 1995 book ‘Smarter Trading‘. It is calculated by dividing the price change over a period by the absolute sum of the price movements that occurred to achieve that change. The resulting ratio ranges between 0 and 1 with higher values representing a more efficient or trending market.
The value of the ER ranges between 0 and 1. It has the value of 1 when prices move in the same direction for the full time over which the indicator is calculated, e.g. n bars period. It has a value of 0 when prices are unchanged over the n periods. When prices move in wide swings within the interval, the sum of the denominator becomes very large compared to the numerator and ER approaches zero.
Some uses for ER:
– A qualifier for a trend following trade; a trend is considered “persistent” only when RE is above a certain value, e.g. 0.3 or 0.4 .
– A filter to screen out choppy stocks/markets, where breakouts are frequently “fakeouts”.
– In an adaptive trading system, helping to determine whether to apply a trend following algorithm or a mean reversion algorithm.
– It is used in the calculation of Kaufman’s Adaptive Moving Average (KAMA).