StrategyQuant
Q AI AssistantAlgoCloudQuantAnalyzerQuantDataManager
Free CourseCompany
BlogDocumentationForumContact us
BlogMarketplace
Log in
Create free account

Product

  • Pricing & licenses
  • Learn
  • Marketplace
  • Start free trial

Legal

  • Terms of Service
  • Privacy Policy
  • Cookies

Contact

[email protected]

Company

StrategyQuant s.r.o.

Korunní 2569/108, Vinohrady, 101 00 Praha 10, Czech Republic, EU

IČ: 04000498

DIČ: CZ04000498

Social

  • Legal Notice | PROCESSING AND PROTECTION OF PERSONAL DATA

    Past performance is no guarantee of future success. All information should be viewed as educational only

    UNITED STATES Disclaimer required by Government - Commodity Futures Trading Commission informs: Futures and options trading have great potential rewards, but also great potential risk. You must be aware of the risks and be willing to accept them in order to invest in the futures and options markets. Don't trade with money you can't afford to lose. This is neither a solicitation nor an offer to buy/sell futures, shares or options on the same. No representation is being made that any account will or is likely to realise profits or losses similar to those discussed in this document. The past performance of any trading system or methodology is not necessarily indicative of future results.

    CFTC RULE 4.41 - HYPOTHETICAL OR SIMULATED PERFORMANCE RESULTS HAVE CERTAIN LIMITATIONS. UNLIKE A RECORD OF ACTUAL PERFORMANCE, SIMULATED RESULTS DO NOT REPRESENT ACTUAL TRADING. ALSO, SINCE THE TRADES WERE NOT EXECUTED, THE RESULTS MAY HAVE OFFSET THE IMPACT, IF ANY, OF CERTAIN MARKET FACTORS, SUCH AS LACK OF LIQUIDITY. SIMULATED TRADING PROGRAMMES IN GENERAL ARE ALSO SUBJECT TO THE FACT THAT THEY ARE DESIGNED WITH THE BENEFIT OF HINDSIGHT. NO REPRESENTATION IS BEING MADE THAT ANY ACCOUNT WILL OR IS LIKELY TO REALISE PROFITS OR LOSSES SIMILAR TO THOSE SHOWN.

    NO REPRESENTATION IS BEING MADE THAT ANY ACCOUNT WILL, OR IS LIKELY TO, REALISE PROFITS OR LOSSES SIMILAR TO THOSE DISCUSSED WITHIN THIS SITE. IF YOU DECIDE TO INVEST REAL MONEY, ALL TRADING DECISIONS IN THE FINANCIAL MARKETS SHOULD BE YOUR OWN.

    © StrategyQuant 2026

    Powered by Klaudie.ai

    Back to marketplaceDIGITAL

    IS and OOS Degradation Score

    StrategyQuantResult Plugins
    IS and OOS Degradation Score

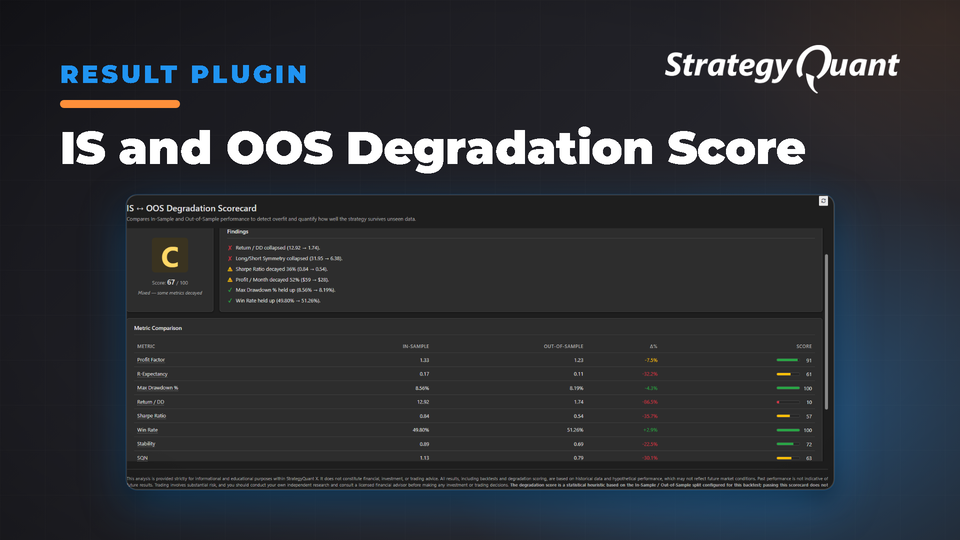
    Automatically scores strategy robustness by comparing In-Sample vs Out-of-Sample performance across 10 key metrics, producing an A–F grade and plain-English findings to identify curve-fit strategies.

    What it does

    Every robust backtest reserves a chunk of data the strategy was never optimized on — the Out-of-Sample period. The honest answer to “did this strategy actually learn the market, or just memorize the training data?” lives in the gap between IS and OOS performance. This plugin computes that gap automatically, for every key metric, and condenses it into something you can read in under ten seconds.

    Open the IS ↔ OOS Degradation Scorecard tab in Results, select any strategy with an IS/OOS split, and the plugin does the rest.


    What you get

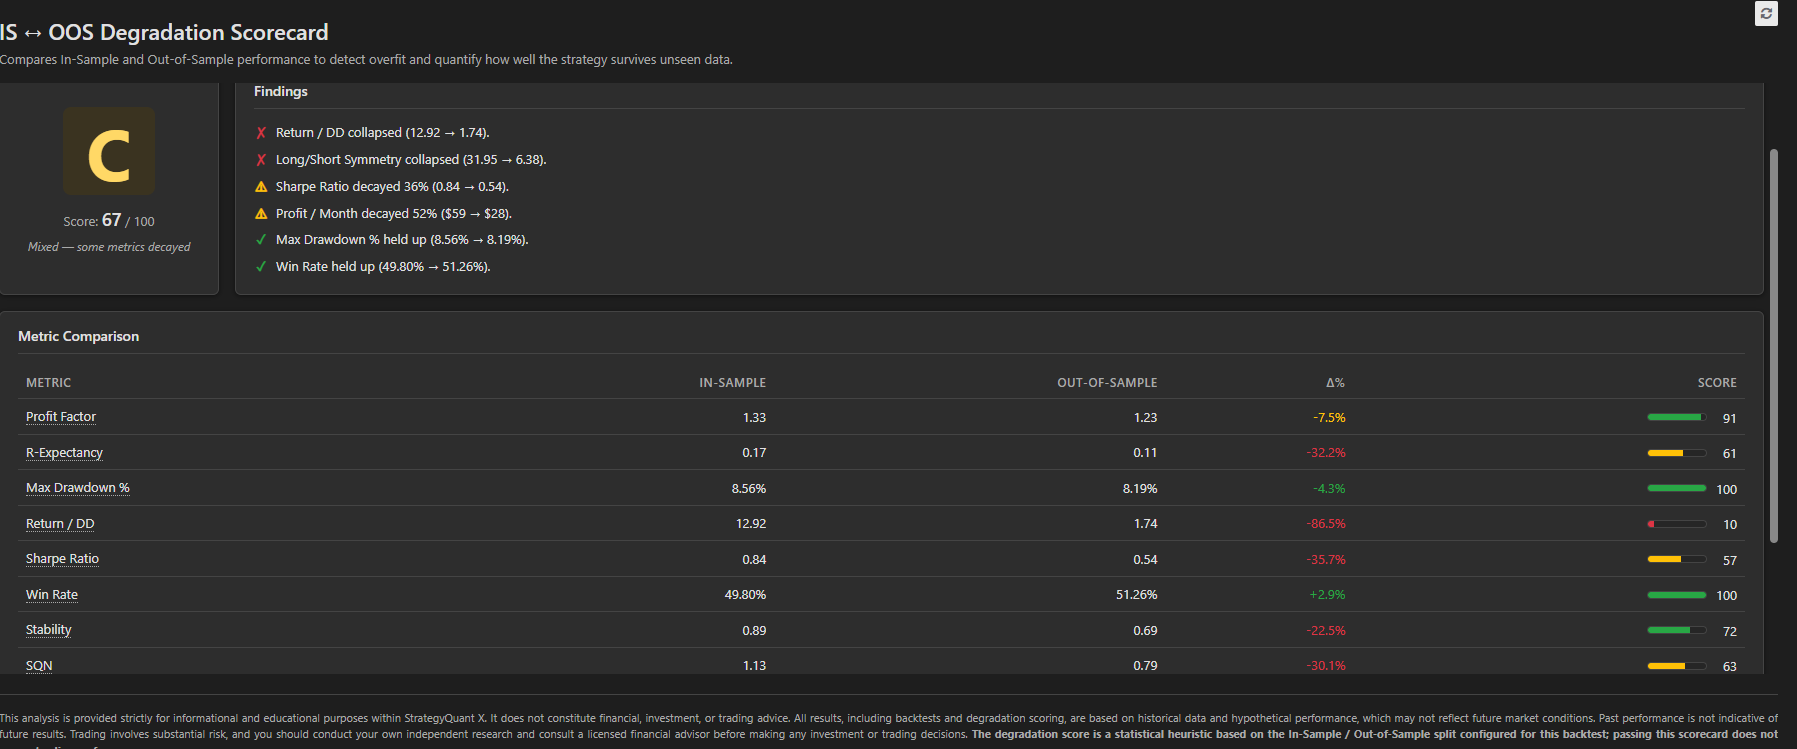
    • A single composite grade (A–F) with a 0–100 score, color-coded so a glance tells the story.
    • A findings panel that turns the numbers into plain English: “Profit Factor fell below 1.0 — strategy is unprofitable Out-of-Sample”, “Max drawdown more than doubled”, “Win rate held up (52% → 51%)”. The top six most important observations, prioritised from critical to good.
    • A side-by-side metric table across 10 robustness indicators: Profit Factor, R-Expectancy, Max Drawdown %, Return/DD, Sharpe, Win Rate, Stability, SQN, monthly profit, and long/short symmetry. Each row shows the IS value, the OOS value, the % change, and an individual 0–100 score bar.
    • An adequacy banner that warns when you only have 22 OOS trades and the result, however good, is statistically meaningless.
    • Hover tooltips on every metric explaining what it is, what its IS→OOS change implies, and what counts as alarming.


    How the scoring works

    Each metric is scored on a retention curve — how well does OOS performance hold up versus IS? Full retention (or improvement) scores 100; mild decay scores 75; significant decay 40; collapse 0. Critical sign-flips (Profit Factor crossing below 1.0, expectancy turning negative, Sharpe going negative) force the metric’s score straight to zero, because in those cases the strategy fundamentally broke. Metrics are then combined with risk-weighted weights that give equal importance to profitability, risk, and consistency.


    Who it’s for

    • Strategy developers doing final sanity-check before adding a candidate to a portfolio.
    • Prop firm traders who need to be confident a passed evaluation strategy wasn’t curve-fit.
    • Quants reviewing batches of strategies generated by AlgoWizard or Builder — sort by grade, focus on the As and Bs, throw the Fs back.


    What it is not

    This is a statistical heuristic, not a guarantee. A good grade means the strategy survived a single holdout split — it does not predict live performance. Use it as one filter among several (Monte Carlo, walk-forward, robustness tests), not as the only one.

    Past performance is no guarantee of future success. All information should be viewed as educational only UNITED STATES Disclaimer required by Government - Commodity Futures Trading Commission informs: Futures and options trading have great potential rewards, but also great potential risk. You must be aware of the risks and be willing to accept them in order to invest in the futures and options markets. Don't trade with money you can't afford to lose. This is neither a solicitation nor an offer to buy/sell futures, shares or options on the same. No representation is being made that any account will or is likely to realise profits or losses similar to those discussed in this document. The past performance of any trading system or methodology is not necessarily indicative of future results. CFTC RULE 4.41 - HYPOTHETICAL OR SIMULATED PERFORMANCE RESULTS HAVE CERTAIN LIMITATIONS. UNLIKE A RECORD OF ACTUAL PERFORMANCE, SIMULATED RESULTS DO NOT REPRESENT ACTUAL TRADING. ALSO, SINCE THE TRADES WERE NOT EXECUTED, THE RESULTS MAY HAVE OFFSET THE IMPACT, IF ANY, OF CERTAIN MARKET FACTORS, SUCH AS LACK OF LIQUIDITY. SIMULATED TRADING PROGRAMMES IN GENERAL ARE ALSO SUBJECT TO THE FACT THAT THEY ARE DESIGNED WITH THE BENEFIT OF HINDSIGHT. NO REPRESENTATION IS BEING MADE THAT ANY ACCOUNT WILL OR IS LIKELY TO REALISE PROFITS OR LOSSES SIMILAR TO THOSE SHOWN. NO REPRESENTATION IS BEING MADE THAT ANY ACCOUNT WILL, OR IS LIKELY TO, REALISE PROFITS OR LOSSES SIMILAR TO THOSE DISCUSSED WITHIN THIS SITE. IF YOU DECIDE TO INVEST REAL MONEY, ALL TRADING DECISIONS IN THE FINANCIAL MARKETS SHOULD BE YOUR OWN.
    Free1 download

    Files

    • ResultsPlugin-ISandOOSDegradationScore.sqm70 KBLocked

    Download unlocks after purchase or with an active tier.

    Details
    Version1.0.0
    PublishedOctober 19, 2026
    Last updatedNovember 2, 2026
    AppSQ
    TypeResultsPlugin
    AuthorTomas Vanek
    App version145.3058
    Codebase categoryResult Plugins