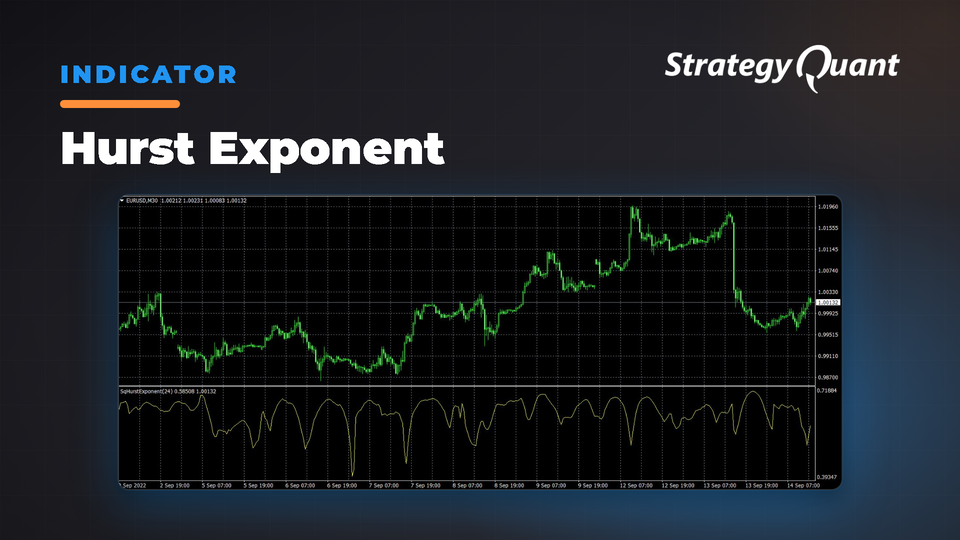
Measures market persistence with the Hurst exponent to detect mean-reverting (H<0.5) or trending (H>0.5) behavior. Helps traders adapt strategies to current market conditions.
We can use the Hurst exponent (H) as a measure for long-term memory of a time series, that is, to measure the amount by which that series deviates from a random walk. The scalar represents the relative tendency of a time series either to regress strongly to the mean (mean-reverting pattern) or to cluster in a certain direction (trending pattern).
The values of the Hurst exponent range between 0 and 1. Based on the value of H, we can classify any time series into one of the three categories:
• If the Indicator value is below 0.5 then we can expect a mean-reverting (anti-persistent) series. The closer the value is to 0, the stronger the mean-reversion process is. In practice, it means that a high value is followed by a low value and vice-versa.
• If the Indicator value is 0.5 — a geometric random walk.
• If the Indicator value is above 0.5 — a trending (persistent) series. The closer the value is to 1, the stronger the trend. In practice, it means that a high value is followed by a higher one.
You know me as clonex. I’m Ivan Hudec — I built the free blocks you’re using here, and I write about the research behind them at algotrading.space. Need something built? Work with me.
Free1 download
Files
Snippet-HurstExponent.sqm34 KBLocked
Download unlocks after purchase or with an active tier.