StrategyQuant
Q AI AssistantAlgoCloudQuantAnalyzerQuantDataManager
Free CourseCompany
BlogDocumentationForumContact us
BlogMarketplace
Log in
Create free account

Product

  • Pricing & licenses
  • Learn
  • Marketplace
  • Start free trial

Legal

  • Terms of Service
  • Privacy Policy
  • Cookies

Contact

[email protected]

Company

StrategyQuant s.r.o.

Korunní 2569/108, Vinohrady, 101 00 Praha 10, Czech Republic, EU

IČ: 04000498

DIČ: CZ04000498

Social

  • Legal Notice | PROCESSING AND PROTECTION OF PERSONAL DATA

    Past performance is no guarantee of future success. All information should be viewed as educational only

    UNITED STATES Disclaimer required by Government - Commodity Futures Trading Commission informs: Futures and options trading have great potential rewards, but also great potential risk. You must be aware of the risks and be willing to accept them in order to invest in the futures and options markets. Don't trade with money you can't afford to lose. This is neither a solicitation nor an offer to buy/sell futures, shares or options on the same. No representation is being made that any account will or is likely to realise profits or losses similar to those discussed in this document. The past performance of any trading system or methodology is not necessarily indicative of future results.

    CFTC RULE 4.41 - HYPOTHETICAL OR SIMULATED PERFORMANCE RESULTS HAVE CERTAIN LIMITATIONS. UNLIKE A RECORD OF ACTUAL PERFORMANCE, SIMULATED RESULTS DO NOT REPRESENT ACTUAL TRADING. ALSO, SINCE THE TRADES WERE NOT EXECUTED, THE RESULTS MAY HAVE OFFSET THE IMPACT, IF ANY, OF CERTAIN MARKET FACTORS, SUCH AS LACK OF LIQUIDITY. SIMULATED TRADING PROGRAMMES IN GENERAL ARE ALSO SUBJECT TO THE FACT THAT THEY ARE DESIGNED WITH THE BENEFIT OF HINDSIGHT. NO REPRESENTATION IS BEING MADE THAT ANY ACCOUNT WILL OR IS LIKELY TO REALISE PROFITS OR LOSSES SIMILAR TO THOSE SHOWN.

    NO REPRESENTATION IS BEING MADE THAT ANY ACCOUNT WILL, OR IS LIKELY TO, REALISE PROFITS OR LOSSES SIMILAR TO THOSE DISCUSSED WITHIN THIS SITE. IF YOU DECIDE TO INVEST REAL MONEY, ALL TRADING DECISIONS IN THE FINANCIAL MARKETS SHOULD BE YOUR OWN.

    © StrategyQuant 2026

    Powered by Klaudie.ai

    Back to marketplaceDIGITAL

    Hull Moving Average Bollinger Bands – HMABB

    StrategyQuantIndicators
    Hull Moving Average Bollinger Bands – HMABB

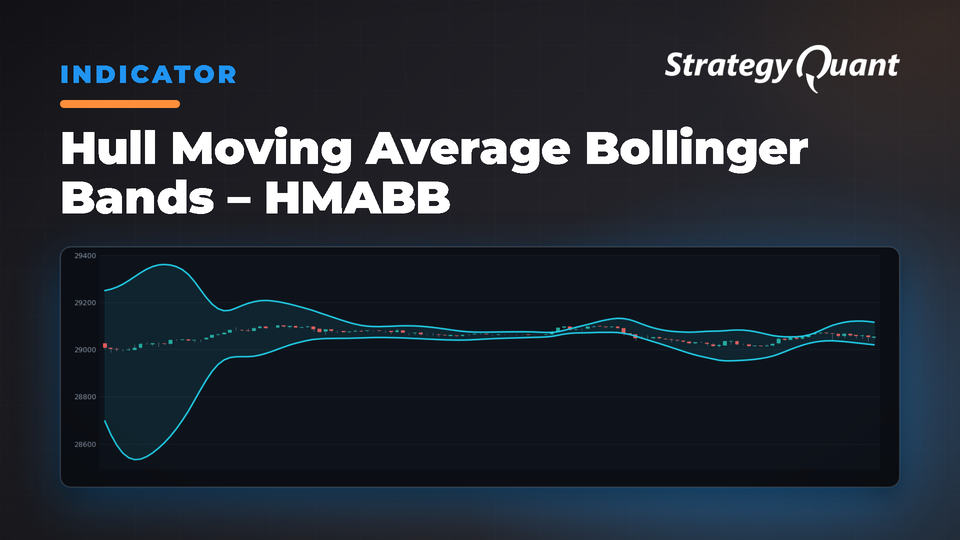
    Combines Hull Moving Average with Bollinger Bands to create dynamic support and resistance levels. Helps traders gauge volatility and price action for identifying entry and exit points and setting stop-loss levels.

    Works in SQX 137 and higher.

    Hull Moving Average (HMA) Bollinger Bands is a technical analysis indicator that combines the concepts of Hull Moving Average (HMA) and Bollinger Bands to create dynamic support and resistance levels, or “bands,” around the HMA line. This indicator helps traders gauge the volatility and price action around the HMA, providing additional insights for potential trade setups.

    Here’s a brief explanation of the two components:

    1. Hull Moving Average (HMA): The Hull Moving Average, developed by Alan Hull, is a fast and smooth moving average designed to reduce lag and improve responsiveness compared to traditional moving averages. The HMA is calculated by taking the weighted moving average (WMA) of the midpoint (half of the period) and subtracting the WMA of the full period. Then, a WMA of the square root of the period is taken from the result. This calculation reduces lag and provides a more responsive moving average line.
    2. Bollinger Bands: Bollinger Bands is a volatility indicator developed by John Bollinger that consists of three lines: a simple moving average (middle band) and two standard deviations above (upper band) and below (lower band) the moving average. The bands widen or narrow based on the volatility of the security’s price, with higher volatility leading to wider bands and lower volatility leading to narrower bands.

    To create HMA Bollinger Bands, you would first calculate the HMA line and then apply the Bollinger Bands methodology using the HMA as the middle line (instead of the simple moving average). This means calculating the standard deviation of the price based on a specific period and then adding or subtracting a multiple of the standard deviation (typically two) from the HMA to form the upper and lower bands.

    HMA Bollinger Bands can be used in various ways, such as identifying potential entry and exit points, setting stop-loss and take-profit levels, and evaluating the strength of trends. They can also be used to determine whether the price is relatively high or low compared to the HMA. Keep in mind, though, that like any technical indicator, HMA Bollinger Bands should be used in conjunction with other tools and analysis techniques to improve trading decisions.

    The indicator has these parameters

    • ComputedFrom – Type of price series
    • Period – Lookback Period of HMA

    • Multiplication – Multiplication of the ATR from the HMA

    Indicator is implemented for: MT4/MT5/Tradestation/ Multicharts

    You can easily do your conditions in Custom blocks. More information you can find here:

    • https://strategyquant.com/doc/strategyquant/custom-blocks/
    • https://strategyquant.com/doc-category/strategy-templates-custom-blocks/
    • https://www.youtube.com/watch?v=CGkn5kh_etc

    In this module, you can also modify the custom blocks – change the periods, change the steps, etc.

    How to import custom indicators to SQX:

    • https://strategyquant.com/doc/programming-for-sq/import-export-custom-indicators-and-other-snippets/

    You know me as clonex. I’m Ivan Hudec — I built the free blocks you’re using here, and I write about the research behind them at algotrading.space. Need something built? Work with me.

    Past performance is no guarantee of future success. All information should be viewed as educational only UNITED STATES Disclaimer required by Government - Commodity Futures Trading Commission informs: Futures and options trading have great potential rewards, but also great potential risk. You must be aware of the risks and be willing to accept them in order to invest in the futures and options markets. Don't trade with money you can't afford to lose. This is neither a solicitation nor an offer to buy/sell futures, shares or options on the same. No representation is being made that any account will or is likely to realise profits or losses similar to those discussed in this document. The past performance of any trading system or methodology is not necessarily indicative of future results. CFTC RULE 4.41 - HYPOTHETICAL OR SIMULATED PERFORMANCE RESULTS HAVE CERTAIN LIMITATIONS. UNLIKE A RECORD OF ACTUAL PERFORMANCE, SIMULATED RESULTS DO NOT REPRESENT ACTUAL TRADING. ALSO, SINCE THE TRADES WERE NOT EXECUTED, THE RESULTS MAY HAVE OFFSET THE IMPACT, IF ANY, OF CERTAIN MARKET FACTORS, SUCH AS LACK OF LIQUIDITY. SIMULATED TRADING PROGRAMMES IN GENERAL ARE ALSO SUBJECT TO THE FACT THAT THEY ARE DESIGNED WITH THE BENEFIT OF HINDSIGHT. NO REPRESENTATION IS BEING MADE THAT ANY ACCOUNT WILL OR IS LIKELY TO REALISE PROFITS OR LOSSES SIMILAR TO THOSE SHOWN. NO REPRESENTATION IS BEING MADE THAT ANY ACCOUNT WILL, OR IS LIKELY TO, REALISE PROFITS OR LOSSES SIMILAR TO THOSE DISCUSSED WITHIN THIS SITE. IF YOU DECIDE TO INVEST REAL MONEY, ALL TRADING DECISIONS IN THE FINANCIAL MARKETS SHOULD BE YOUR OWN.
    Free

    Files

    • Snippet-HullMovingAverageBollingerBandsHMABB.sqm33 KBLocked

    Download unlocks after purchase or with an active tier.

    Details
    Version1.0.0
    PublishedOctober 19, 2026
    Last updatedNovember 2, 2026
    AppSQ
    TypeSnippet
    Authorclonex / Ivan Hudec
    App version145.3058
    Codebase categoryIndicators / Signals