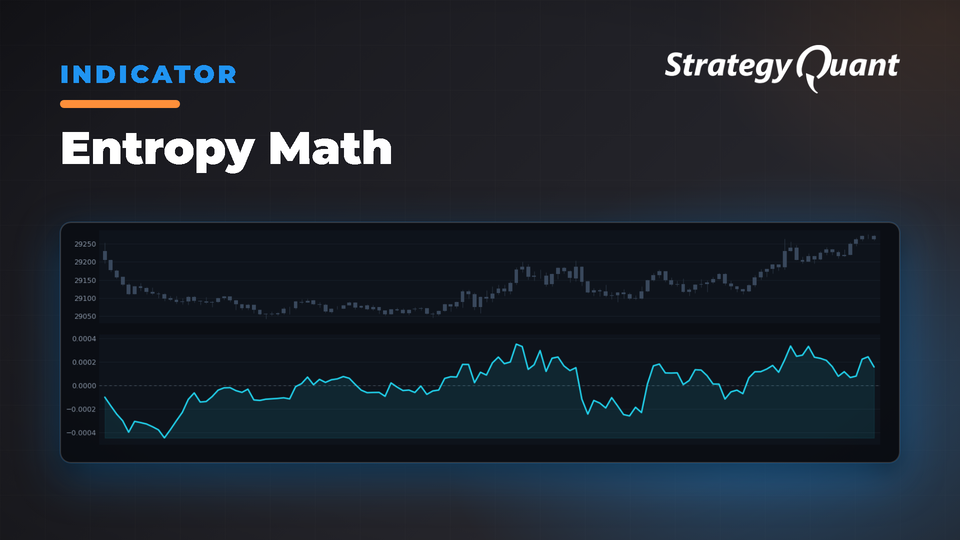
Detects hidden patterns in price action using entropy and chaos theory principles. Applies maximum entropy method to find market structure within apparent randomness.
Entropy is a measure of disorder, a term used for the most part in physics. In simple words: the level of entropy is determined by the degree of uniformity of the distribution of something (for example, matter) in space. If the salt with the water lay in a cube, the entropy of the state is small, and if it is dissolved and distributed evenly throughout the glass, then it is large. How to measure the state of the chaos? The question is rhetorical. Indeed, the greater the entropy, the greater the number of variations of permutations in it is possible. A cube of salt in water can be located in only a few positions and a dissolved cube in as many as you like. There is something similar in the market.The concept of entropy is associated with chaos, where there are billions of possible variations. But this does not mean at all that it is impossible to find a pattern in it. The starry sky can be called high entropy, but nevertheless, there are constellations in it. The Entropy Math indicator looks for patterns on the basis of which a trading strategy is built.