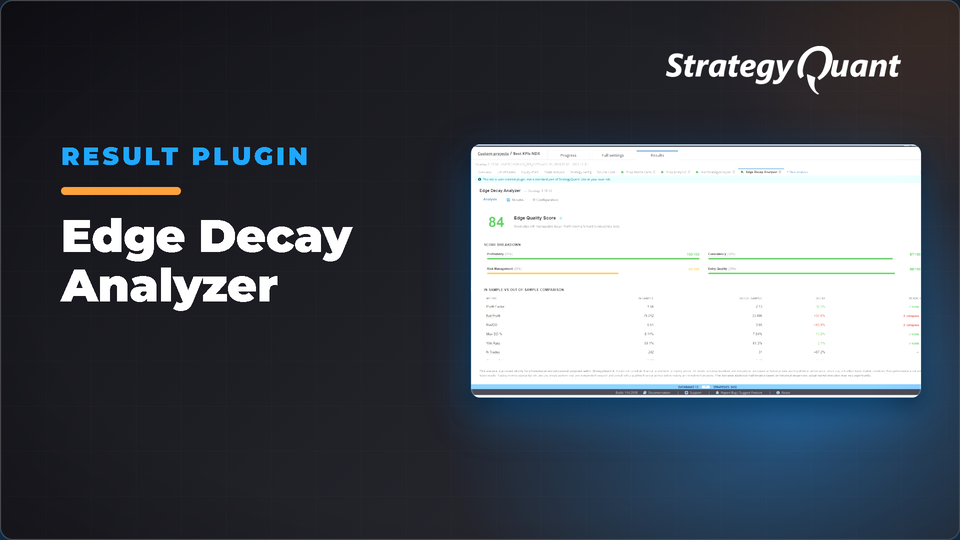
Rates strategies 0–100 (A–F grades) by measuring edge quality and In-Sample to Out-of-Sample decay. Quickly spot overfitting and filter candidates for further robustness testing.
If you build algorithmic strategies in StrategyQuant X, you already know the hard part isn’t generating candidates — it’s deciding which ones are real. A backtest can look spectacular In-Sample and quietly fall apart Out-of-Sample. Edge Decay Analyzer is a free custom Results plugin for SQX 144+ that gives you an objective, configurable answer: a single 0–100 score with an A–F grade, plus the breakdown to back it up.
What it actually does
The plugin installs as a new tab inside the Results section of every strategy. Select a strategy, open the tab, and it measures the quality of the edge and — crucially — how much that edge degrades from In-Sample to Out-of-Sample.
Use it to:
• Filter candidates fast — A/B = strong, C = needs validation, D/F = discard. Roughly 30 seconds per strategy.
• Detect overfitting — spot strategies whose IS edge simply doesn’t survive in OOS.
• Compare two strategies objectively with a number instead of a gut feeling.
• Understand real psychological risk by visualizing losing and winning streaks.
Just as important is what it doesn’t claim to do. It’s not a replacement for the Monkey Test, Walk Forward Matrix, or Monte Carlo. It won’t promise live profitability — only demo and forward testing can. And it’s 100% read-only: it reads data via the PostMessage API, never writes to your databanks, never touches your strategies.
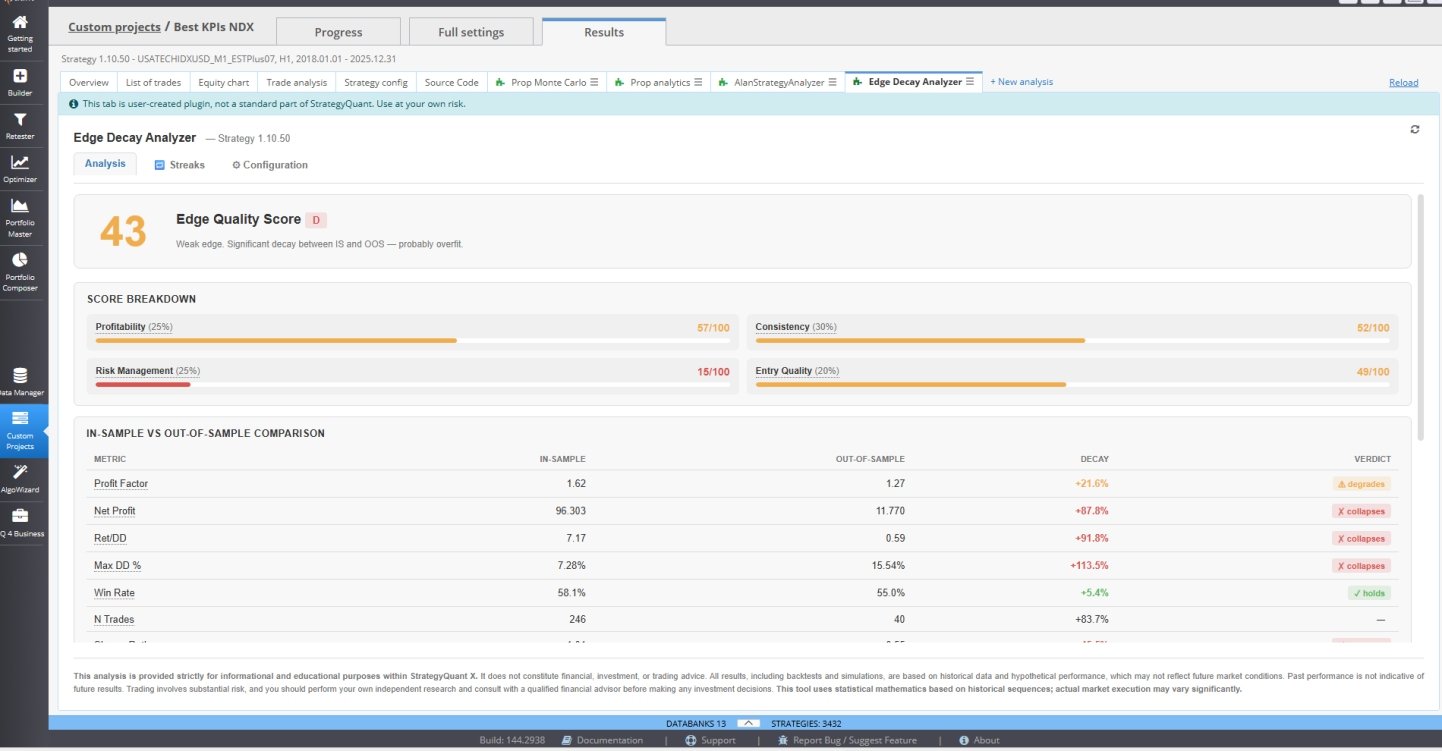
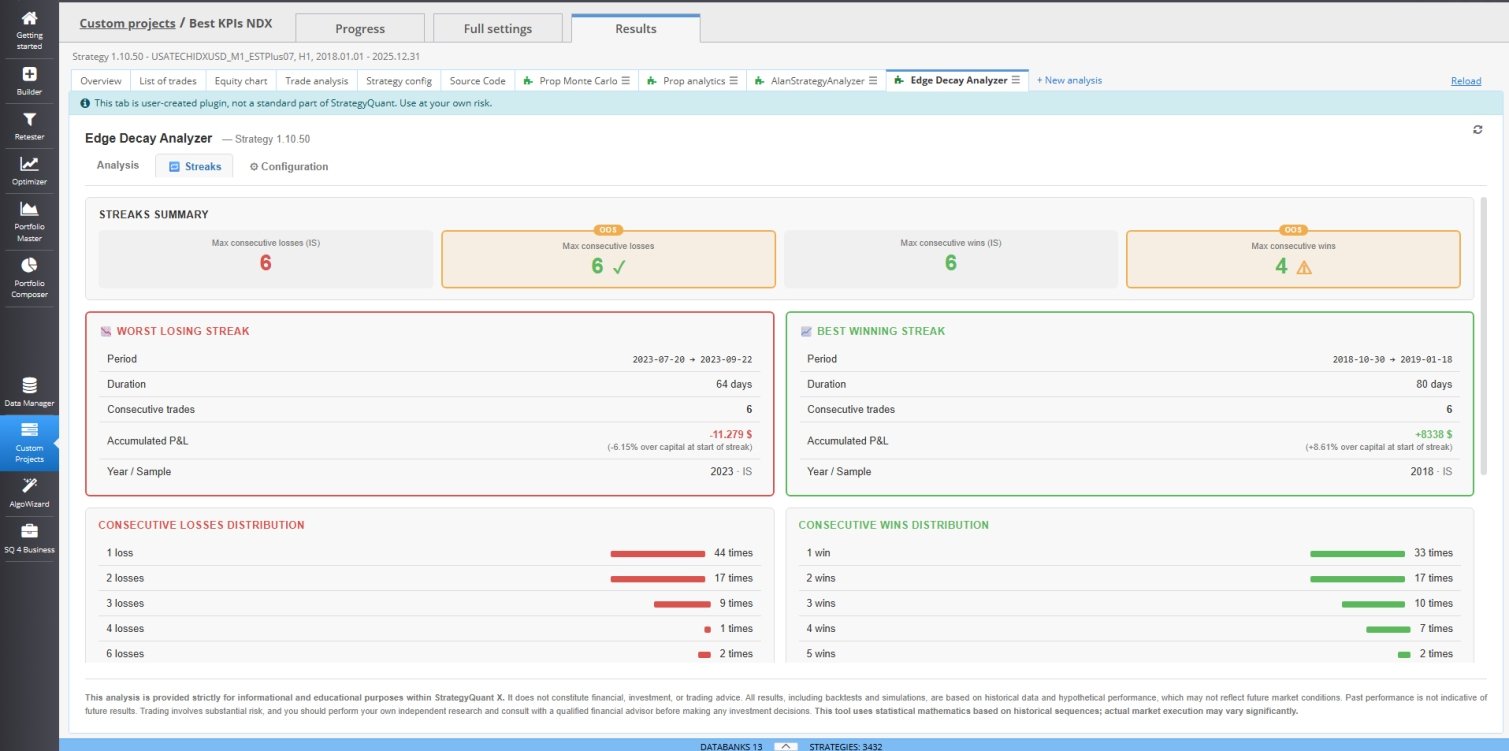
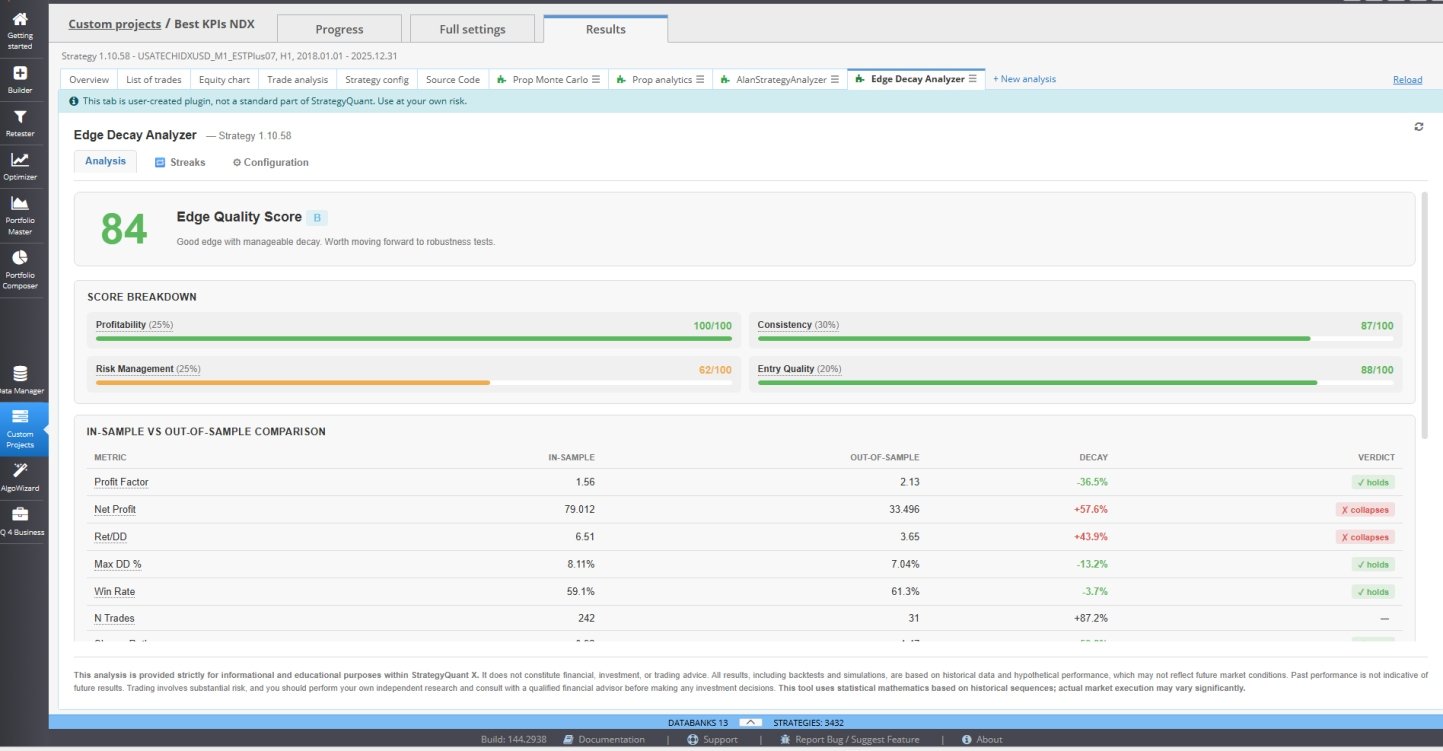
The score: 4 pillars
The total score is a weighted sum of four pillars (default “Strategy” mode weights):
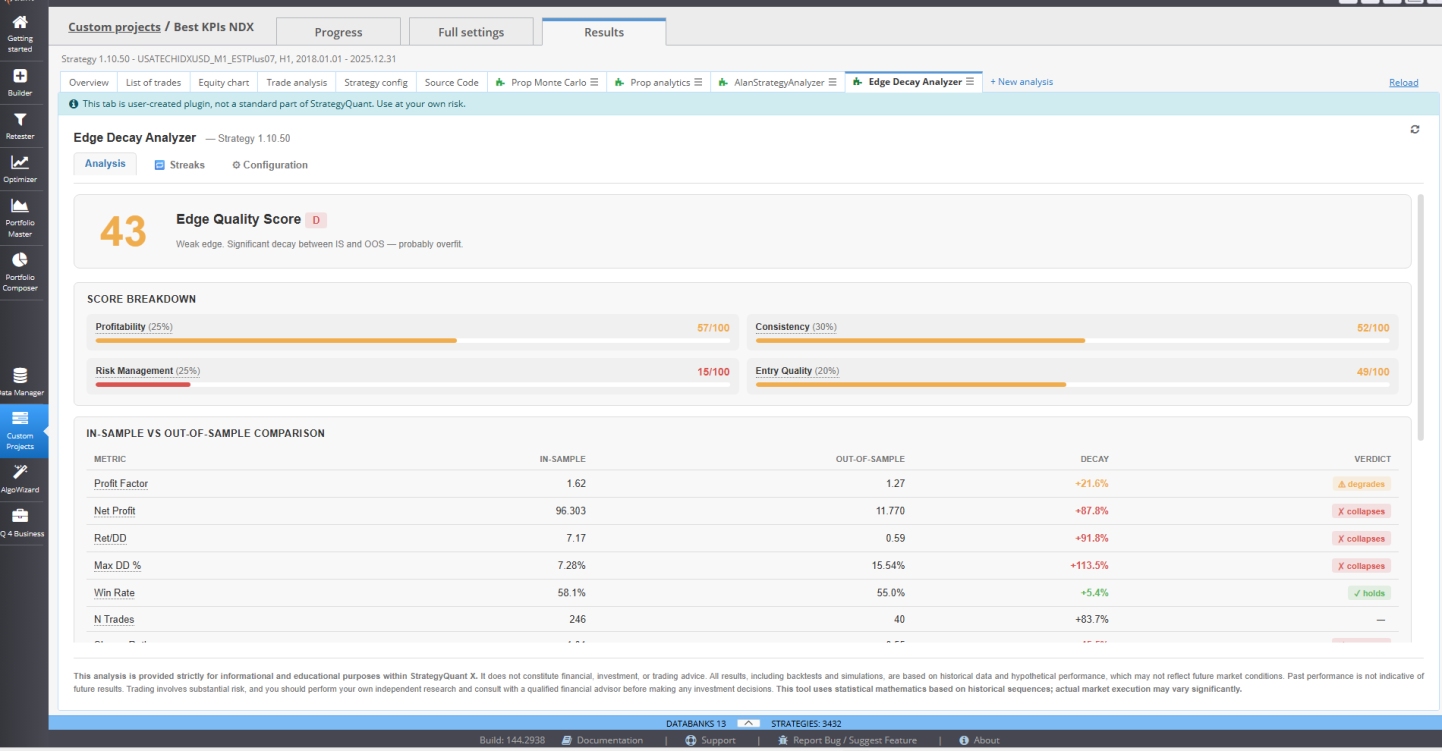
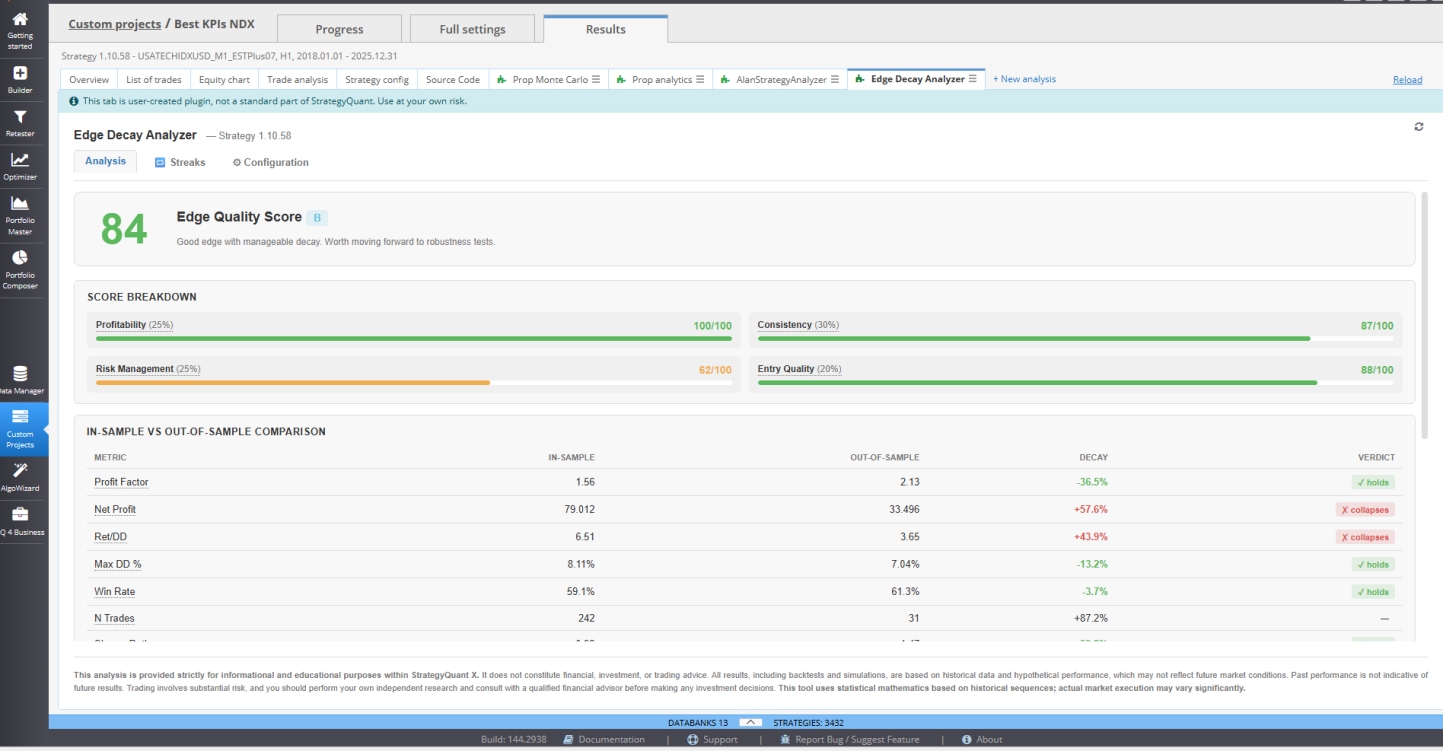
Pillar Weight What it measures Profitability 25% Profit Factor, Net Profit, Avg Trade — all OOS Consistency 30% Stability, PF decay IS→OOS, Win Rate — the highest weight, because persistence is the best predictor of future success Risk Management 25% Return/DD, Max DD%, Sharpe Ratio Entry Quality 20% Median XS (MFE/MAE) — pure entry-signal quality
Each metric uses a transparent linear threshold system (0 / 50 / 100-point anchors with interpolation between them), so you always know why a strategy scored what it did.
Grade scale:
Score Grade Verdict 85–100 A Excellent edge. Very likely to persist OOS 70–84 B Good edge, manageable decay. Advance to robustness tests 55–69 C Reasonable but degrading. Validate carefully 40–54 D Weak edge, significant decay. Probably overfit <40 F Edge collapses OOS. Not recommended
Three tabs
• Analysis — the headline score, the four pillars, an 8-metric IS-vs-OOS comparison table (color-coded Holds / Degrades / Collapses), an XS-by-year chart, and a concurrency check that warns you if your edge secretly depends on Allow Duplicate Trades.
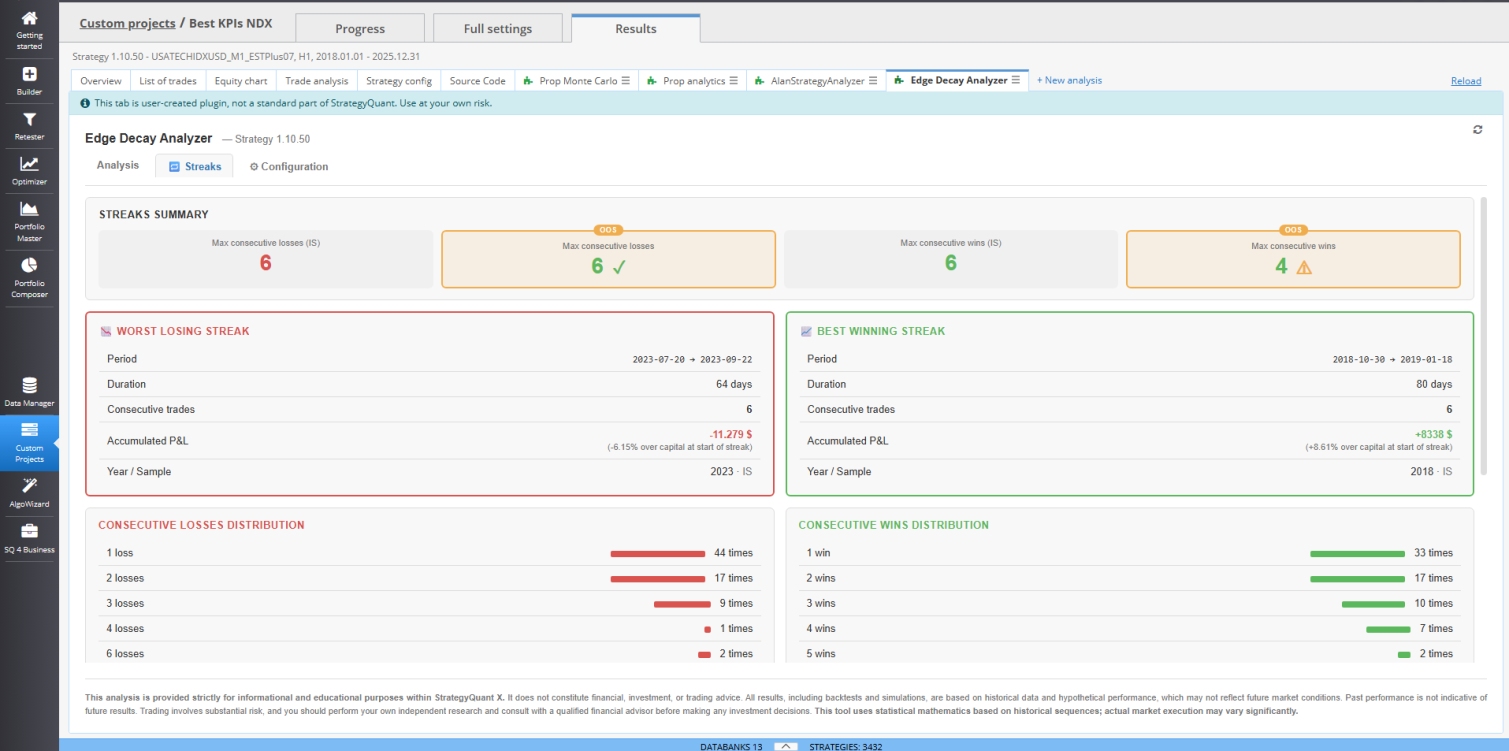
• Streaks — worst and best streaks with dates, duration, and accumulated P&L; histograms that tell you whether a 6-loss streak was a one-off outlier or normal operation; and a mirror chart of wins/losses by year. The real question it answers: could you actually sit through the worst-case streak without pulling the plug?
• Configuration — switch between Edge and Strategy modes (the plugin auto-adjusts weights and thresholds), apply asset presets (Indices, Forex, Commodities, Crypto), and fine-tune every threshold. Settings persist in localStorage.
Edge mode vs Strategy mode
This is one of the most useful touches. If you’re evaluating a raw signal — Exit After Bars only, no SL/TP, fixed lot size — Edge mode relaxes the risk metrics (drawdown is naturally larger without a stop) and reweights toward Consistency and Entry Quality, so you measure the signal without trade-management noise. For complete systems with SL/TP/trailing, Strategy mode validates the whole thing with standard weights.
Installation
1. Close StrategyQuant X completely.
2. Copy the entireEdge Decay Analyzer folder — including index.html, locales/, and vue.global.prod.js — into: [SQX Installation]/user/extend/ResultsPlugins/Edge Decay Analyzer/
3. Reopen SQX.
4. Select a strategy → Results tab → Edge Decay Analyzer.
Requirements: SQX 144+ and a Pro license (3 plugins max) or Ultimate (unlimited). Starter licenses don’t support custom plugins.
Languages: English and Spanish, auto-detected from your SQX settings.
Uninstalling is just as clean — close SQX, delete the folder, reopen. No residue, no core modifications.
The philosophy
The plugin sticks to four principles: transparency over guesswork (if data can’t be computed correctly, it warns you — it never invents numbers), configurability (thresholds adapt to asset and strategy type), complementary not substitute (it’s a fast filter, not a replacement for full robustness testing), and a focus on consistency (because the persistence of the edge from IS to OOS is what actually predicts the future).
Think of Edge Decay Analyzer as the first gate in your pipeline: a fast, objective way to decide which strategies are worth the expensive robustness tests — and which ones to drop before they waste your time.
Edge Decay Analyzer v1.0 · for StrategyQuant X 144+
Credits:
Creator: Fran Bolufer Comunity: SQX Traders