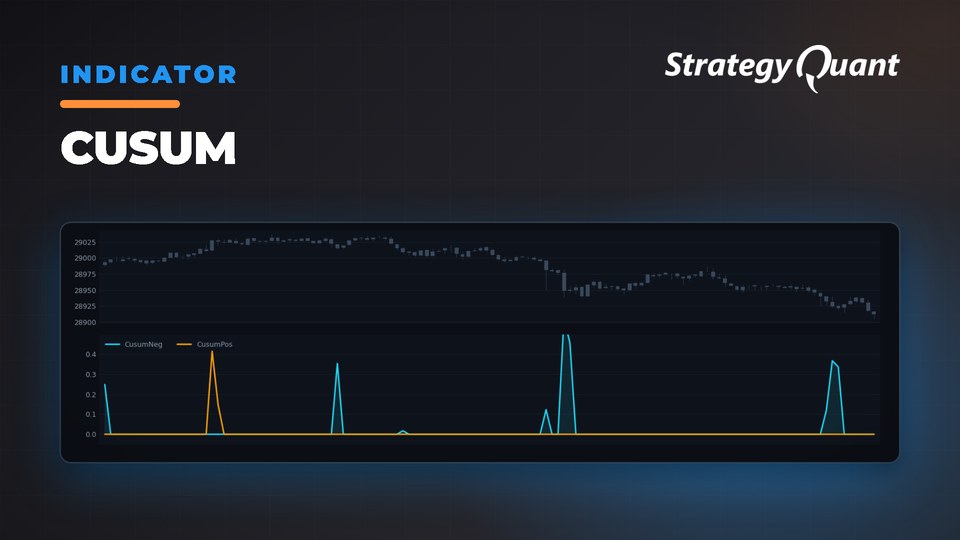
Detects subtle but sustained shifts in price behavior using cumulative sum analysis. Tracks upward and downward deviations with configurable thresholds to generate reliable trading signals.
CUSUM Indicator in StrategyQuant
In today’s post, we’ll take a closer look at a custom implementation of the CUSUM (Cumulative Sum) indicator. Often used in statistical process control, the CUSUM technique helps detect small shifts in the mean level of a series. This particular implementation is designed for integration into StrategyQuant, offering traders a dynamic way to monitor and react to market changes.
What Is CUSUM?
CUSUM is a sequential analysis technique that accumulates deviations from a target value over time. By comparing the cumulative sum against defined thresholds, it becomes easier to spot even subtle shifts in price behavior. In our implementation, two separate accumulators—one for upward movements (CUSUM Positive) and one for downward movements (CUSUM Negative)—signal when the change in the underlying price series becomes significant.
Code Walkthrough
The indicator is defined as a Java class that extends
IndicatorBlock
, ensuring seamless integration with StrategyQuant’s ecosystem. Let’s break down the key components:
Parameters and Inputs
• Chart Data: The indicator uses a chart (typically the close price) as the data source.
• Period: Determines the window size over which the rolling mean and standard deviation are calculated. This is crucial as it defines the sensitivity of the indicator.
• Threshold (k): Sets the detection threshold. A higher threshold means the indicator becomes less sensitive, reducing false signals.
• Drift (μ): Accounts for the expected drift in the process, enabling the detection of smaller but persistent changes.
@Parameter(defaultChartIndex=0)
public ChartData Chart;
@Parameter(category="Default", name="Period", minValue=1, maxValue=10000, defaultValue="20", step=1)
public int Period;
@Parameter(category="Default", name="Threshold", minValue=0.1, maxValue=100, defaultValue="2", step=0.1)
@Help("Detection threshold (k) - higher values make the indicator less sensitive")
public double Threshold;
@Parameter(category="Default", name="Drift", minValue=0, maxValue=10, defaultValue="0.5", step=0.1)
@Help("Expected drift in the process (mu) - helps detect smaller persistent changes")
public double Drift;
Rolling Statistics Calculation
For each new bar (or time point), the code computes the rolling mean and standard deviation over the defined period. These statistics serve as the baseline to standardize the current price data.
double sum = 0;
double sumSquares = 0;
for (int i = 0; i < Period; i++) {
double price = Chart.Close(i);
sum += price;
sumSquares += price * price;
}
double mean = sum / Period;
double variance = (sumSquares - (sum * sum / Period)) / (Period - 1);
double stdDev = Math.sqrt(variance);
// Prevent division by zero
if (stdDev == 0) {
stdDev = 1;
}
Standardization and CUSUM Calculation
The current price is standardized by subtracting the mean and dividing by the standard deviation. The standardized value is then used to update the CUSUM accumulators:
• CUSUM Positive: Accumulates positive deviations.
• CUSUM Negative: Accumulates negative deviations.
Each update subtracts both the drift and the threshold, ensuring that only significant deviations contribute to the cumulative sum.
// Get current standardized value
double currentValue = (Chart.Close(0) - mean) / stdDev;
// Calculate CUSUM values
double prevCusumPos = getCurrentBar() > Period ? CusumPos.get(1) : 0;
double prevCusumNeg = getCurrentBar() > Period ? CusumNeg.get(1) : 0;
// Upper CUSUM
CusumPos.set(0, Math.max(0, prevCusumPos + currentValue - Drift - Threshold));
// Lower CUSUM
CusumNeg.set(0, Math.max(0, prevCusumNeg - currentValue - Drift - Threshold));
Handling Edge Cases
An important detail is the check for the standard deviation. When price data are too consistent (resulting in a standard deviation of zero), the code resets it to 1. This safeguard prevents division errors and keeps the indicator robust under low-volatility conditions.
Bringing It All Together
This CUSUM indicator is a powerful tool for traders looking to catch subtle but sustained changes in price action. By dynamically adjusting to recent market data (through rolling statistics) and accounting for noise via the threshold and drift parameters, the indicator offers a balanced approach to signal generation.
If you’re interested in incorporating this indicator into your trading strategies, the code is structured to be both adaptable and easy to integrate within the StrategyQuant environment.
You know me as clonex. I'm Ivan Hudec — I built the free blocks you're using here, and I write about the research behind them at algotrading.space. Need something built? Work with me.