StrategyQuant
Q AI AssistantAlgoCloudQuantAnalyzerQuantDataManager
Free CourseCompany
BlogDocumentationForumContact us
BlogMarketplace
Log in
Create free account

Product

  • Pricing & licenses
  • Learn
  • Marketplace
  • Start free trial

Legal

  • Terms of Service
  • Privacy Policy
  • Cookies

Contact

[email protected]

Company

StrategyQuant s.r.o.

Korunní 2569/108, Vinohrady, 101 00 Praha 10, Czech Republic, EU

IČ: 04000498

DIČ: CZ04000498

Social

  • Legal Notice | PROCESSING AND PROTECTION OF PERSONAL DATA

    Past performance is no guarantee of future success. All information should be viewed as educational only

    UNITED STATES Disclaimer required by Government - Commodity Futures Trading Commission informs: Futures and options trading have great potential rewards, but also great potential risk. You must be aware of the risks and be willing to accept them in order to invest in the futures and options markets. Don't trade with money you can't afford to lose. This is neither a solicitation nor an offer to buy/sell futures, shares or options on the same. No representation is being made that any account will or is likely to realise profits or losses similar to those discussed in this document. The past performance of any trading system or methodology is not necessarily indicative of future results.

    CFTC RULE 4.41 - HYPOTHETICAL OR SIMULATED PERFORMANCE RESULTS HAVE CERTAIN LIMITATIONS. UNLIKE A RECORD OF ACTUAL PERFORMANCE, SIMULATED RESULTS DO NOT REPRESENT ACTUAL TRADING. ALSO, SINCE THE TRADES WERE NOT EXECUTED, THE RESULTS MAY HAVE OFFSET THE IMPACT, IF ANY, OF CERTAIN MARKET FACTORS, SUCH AS LACK OF LIQUIDITY. SIMULATED TRADING PROGRAMMES IN GENERAL ARE ALSO SUBJECT TO THE FACT THAT THEY ARE DESIGNED WITH THE BENEFIT OF HINDSIGHT. NO REPRESENTATION IS BEING MADE THAT ANY ACCOUNT WILL OR IS LIKELY TO REALISE PROFITS OR LOSSES SIMILAR TO THOSE SHOWN.

    NO REPRESENTATION IS BEING MADE THAT ANY ACCOUNT WILL, OR IS LIKELY TO, REALISE PROFITS OR LOSSES SIMILAR TO THOSE DISCUSSED WITHIN THIS SITE. IF YOU DECIDE TO INVEST REAL MONEY, ALL TRADING DECISIONS IN THE FINANCIAL MARKETS SHOULD BE YOUR OWN.

    © StrategyQuant 2026

    Powered by Klaudie.ai

    Back to marketplaceDIGITAL

    CSSA Market Regime

    StrategyQuantIndicators
    CSSA Market Regime

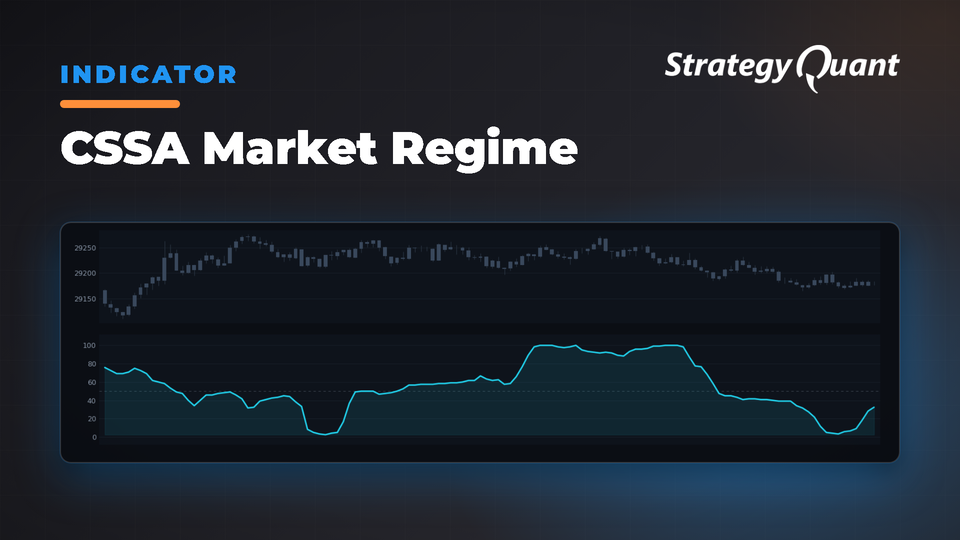
    Identifies market regimes by measuring complexity through range fractality analysis. Values above 0.5 indicate chaotic market conditions; below 0.5 signal stable, predictable trading environments.

    The essence of self-similarity and complexity is to compare the whole to its component parts. For example lets take a square that is divided into four separate squares of equal size. The area of the larger square is equivalent to the sum of the areas of each of its component squares. The same of course is true of a one-dimensional line which is equivalent to the sum of its parts. One of the methods of identifying self-similarity in the stock market is to look at the range or the difference between the highs and the lows. We would expect that in a perfectly self-similar market the longer range would be equivalent to the sum of the ranges measured over a smaller interval. The more chaotic the market is, the greater the difference will be between these two measures. Such market conditions would be characterized by a large ratio between the sum of smaller ranges versus the longer measure of range. Essentially this relationship is called fractal dimension and is a measure of complexity. There are many different ways to measure this including using the Hurst exponent, but the problem I have always found in my own humble research is that the suggested thresholds defined by specific absolute values do not seem to reflect the information consistent with theory. I have often found that relative measures tend to be more robust and consistent- much the same way that the magnitude of past returns has less predictive value than the relative rank of past returns. Relative measures tend to be more stationary than absolute values. To compute this measure of self-similarity I use the intraday range (high minus low) versus a longer range window. Here is how it is calculated:

    1) find the high minus the low for each day going back 10 days
    2) take the sum of these values (sum of the pieces)
    3) find the 10-day range by taking the 10-day maximum (including the highs) and subtracting out the 10-day minimum (whole range)
    4) divide the sum of the pieces by the whole range- this is a basic measure of fractal dimension/complexity
    5) take the 60-day average of the 10-day series of the complexity values- this is the quarterly “chaos/stability” metric
    6) use either the 252-day normsdist of the z-score or the percentile ranking of the chaos/stability metric
    7) values above .5 indicate that the market is in a “chaos” regime and is much less predictable and non-stationary, values below .5 indicate that the market is stable and much more predictable.

    Idea Author: David Varadi

    Source: https://cssanalytics.wordpress.com/2015/03/13/using-a-self-similarity-metric-with-intraday-data-to-define-market-regimes/

    Indicator is implemented for: MT4/MT5/Tradestation/ Multicharts

    How to import custom indicators to SQX: https://strategyquant.com/doc/programming-for-sq/import-export-custom-indicators-and-other-snippets/

    Past performance is no guarantee of future success. All information should be viewed as educational only UNITED STATES Disclaimer required by Government - Commodity Futures Trading Commission informs: Futures and options trading have great potential rewards, but also great potential risk. You must be aware of the risks and be willing to accept them in order to invest in the futures and options markets. Don't trade with money you can't afford to lose. This is neither a solicitation nor an offer to buy/sell futures, shares or options on the same. No representation is being made that any account will or is likely to realise profits or losses similar to those discussed in this document. The past performance of any trading system or methodology is not necessarily indicative of future results. CFTC RULE 4.41 - HYPOTHETICAL OR SIMULATED PERFORMANCE RESULTS HAVE CERTAIN LIMITATIONS. UNLIKE A RECORD OF ACTUAL PERFORMANCE, SIMULATED RESULTS DO NOT REPRESENT ACTUAL TRADING. ALSO, SINCE THE TRADES WERE NOT EXECUTED, THE RESULTS MAY HAVE OFFSET THE IMPACT, IF ANY, OF CERTAIN MARKET FACTORS, SUCH AS LACK OF LIQUIDITY. SIMULATED TRADING PROGRAMMES IN GENERAL ARE ALSO SUBJECT TO THE FACT THAT THEY ARE DESIGNED WITH THE BENEFIT OF HINDSIGHT. NO REPRESENTATION IS BEING MADE THAT ANY ACCOUNT WILL OR IS LIKELY TO REALISE PROFITS OR LOSSES SIMILAR TO THOSE SHOWN. NO REPRESENTATION IS BEING MADE THAT ANY ACCOUNT WILL, OR IS LIKELY TO, REALISE PROFITS OR LOSSES SIMILAR TO THOSE DISCUSSED WITHIN THIS SITE. IF YOU DECIDE TO INVEST REAL MONEY, ALL TRADING DECISIONS IN THE FINANCIAL MARKETS SHOULD BE YOUR OWN.
    Free

    Files

    • Snippet-CSSAMarketRegime.sqm36 KBLocked

    Download unlocks after purchase or with an active tier.

    Details
    Version1.0.0
    PublishedOctober 19, 2026
    Last updatedOctober 22, 2026
    AppSQ
    TypeSnippet
    Authorclonex / Ivan Hudec
    App version145.3058
    Codebase categoryIndicators / Signals