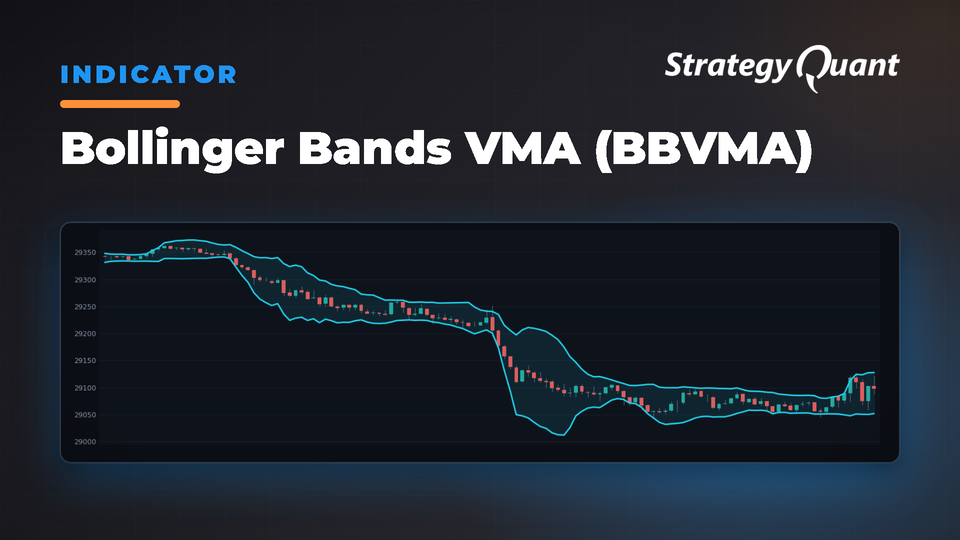
Combines Variable Moving Average with Bollinger Bands using efficiency-based adaptation. Provides adaptive trend analysis with dynamic support/resistance levels and reduces false signals in choppy markets.
The Bollinger Bands VMA indicator combines Tushar Chande’s Variable Moving Average (VMA) with traditional Bollinger Bands to provide enhanced trend analysis with efficiency-based adaptive smoothing. This indicator creates a sophisticated approach to trend identification by using an adaptive moving average that responds to market efficiency as the center line, surrounded by volatility-based statistical bands.
How It Works
The indicator operates in two main stages:
1. Variable Moving Average (VMA) Calculation: Uses an efficiency ratio to create an adaptive smoothing factor that adjusts based on the relationship between net price movement and total price volatility. When markets are trending efficiently, the VMA becomes more responsive; when markets are choppy or sideways, it becomes smoother.
2. Bollinger Bands Application: Calculates standard deviation of the input price series and creates upper and lower bands around the VMA center line using a specified standard deviation multiplier.
The VMA algorithm dynamically adjusts its smoothing constant based on market efficiency, making it more responsive during strong trending periods and providing better noise filtering during volatile but directionless market conditions.
Parameters
The indicator accepts the following parameters:
• Period (default: 14) – Lookback period for efficiency ratio and VMA calculation
• VolFactor (default: 2) – Multiplier for the efficiency ratio in smoothing constant calculation
• StdDevFactor (default: 2) – Standard deviation multiplier for band calculation around VMA
Outputs
The indicator produces two outputs:
• Upper (Red) – Upper volatility band above VMA center line
• Lower (Red) – Lower volatility band below VMA center line
Implementation Details
The indicator calculates the Efficiency Ratio using:
Net Change = |Close[0] - Close[Period]| Total Volatility = Sum of |Close[i] - Close[i+1]| over Period Efficiency Ratio = Net Change / Total Volatility
The VMA calculation uses an adaptive smoothing constant:
Smoothing Constant = (Efficiency Ratio)² × VolFactor Fast SC = 2/(2+1) = 0.667 Slow SC = 2/(30+1) = 0.065 Alpha = (Smoothing Constant × (Fast SC - Slow SC)) + Slow SC VMA = Alpha × Price + (1 - Alpha) × Previous VMA
The Bollinger Bands are calculated as:
• Upper Band = VMA + (StdDevFactor × StandardDeviation)
• Lower Band = VMA – (StdDevFactor × StandardDeviation)
Note: The standard deviation is calculated from the input price series, not the VMA values.
Parameter Sets
Three optimized parameter sets are included:
1. Short-term: Period=14, VolFactor=2, StdDevFactor=2
2. Standard: Period=20, VolFactor=2, StdDevFactor=2
3. Long-term: Period=50, VolFactor=2, StdDevFactor=2
Usage
The indicator can be used to:
• Identify adaptive trend direction based on VMA positioning and market efficiency
• Determine dynamic support and resistance levels using the upper and lower bands
• Assess market efficiency and trending strength through VMA responsiveness
• Generate entry signals when price breaks above upper band (efficient uptrend) or below lower band (efficient downtrend)
• Spot consolidation periods when efficiency ratio is low and VMA becomes less responsive
• Reduce false signals during choppy markets due to VMA’s efficiency-based smoothing
• Identify potential breakout conditions when price approaches bands during high-efficiency periods
The VMA’s unique efficiency-based adaptation makes it particularly effective at distinguishing between genuine trends and random price movements. When markets move efficiently in one direction, the VMA quickly adapts to follow the trend. When markets are volatile but directionless, the VMA provides superior noise filtering compared to traditional moving averages.
Indicator Availability:
This indicator is implemented for MT4, MT5, TradeStation, and MultiCharts.
Using Custom Blocks for Conditions:
You can easily define your own conditions in StrategyQuant X using Custom Blocks. This allows you to set up parameters such as periods or steps to fine-tune the indicator to your strategy. For more detailed information, refer to the following resources:
• StrategyQuant Documentation: Custom Blocks
• StrategyQuant Documentation: Strategy Templates & Custom Blocks
• StrategyQuant YouTube Tutorial: Custom Blocks Overview
Importing Custom Indicators into SQX:
To import custom indicators into StrategyQuant X, follow the step-by-step instructions provided here:
Import & Export Custom Indicators and Other Snippets
You know me as clonex. I'm Ivan Hudec — I built the free blocks you're using here, and I write about the research behind them at algotrading.space. Need something built? Work with me.