StrategyQuant
Q AI AssistantAlgoCloudQuantAnalyzerQuantDataManager
Free CourseCompany
BlogDocumentationForumContact us
BlogMarketplace
Log in
Create free account

Product

  • Pricing & licenses
  • Learn
  • Marketplace
  • Start free trial

Legal

  • Terms of Service
  • Privacy Policy
  • Cookies

Contact

[email protected]

Company

StrategyQuant s.r.o.

Korunní 2569/108, Vinohrady, 101 00 Praha 10, Czech Republic, EU

IČ: 04000498

DIČ: CZ04000498

Social

  • Legal Notice | PROCESSING AND PROTECTION OF PERSONAL DATA

    Past performance is no guarantee of future success. All information should be viewed as educational only

    UNITED STATES Disclaimer required by Government - Commodity Futures Trading Commission informs: Futures and options trading have great potential rewards, but also great potential risk. You must be aware of the risks and be willing to accept them in order to invest in the futures and options markets. Don't trade with money you can't afford to lose. This is neither a solicitation nor an offer to buy/sell futures, shares or options on the same. No representation is being made that any account will or is likely to realise profits or losses similar to those discussed in this document. The past performance of any trading system or methodology is not necessarily indicative of future results.

    CFTC RULE 4.41 - HYPOTHETICAL OR SIMULATED PERFORMANCE RESULTS HAVE CERTAIN LIMITATIONS. UNLIKE A RECORD OF ACTUAL PERFORMANCE, SIMULATED RESULTS DO NOT REPRESENT ACTUAL TRADING. ALSO, SINCE THE TRADES WERE NOT EXECUTED, THE RESULTS MAY HAVE OFFSET THE IMPACT, IF ANY, OF CERTAIN MARKET FACTORS, SUCH AS LACK OF LIQUIDITY. SIMULATED TRADING PROGRAMMES IN GENERAL ARE ALSO SUBJECT TO THE FACT THAT THEY ARE DESIGNED WITH THE BENEFIT OF HINDSIGHT. NO REPRESENTATION IS BEING MADE THAT ANY ACCOUNT WILL OR IS LIKELY TO REALISE PROFITS OR LOSSES SIMILAR TO THOSE SHOWN.

    NO REPRESENTATION IS BEING MADE THAT ANY ACCOUNT WILL, OR IS LIKELY TO, REALISE PROFITS OR LOSSES SIMILAR TO THOSE DISCUSSED WITHIN THIS SITE. IF YOU DECIDE TO INVEST REAL MONEY, ALL TRADING DECISIONS IN THE FINANCIAL MARKETS SHOULD BE YOUR OWN.

    © StrategyQuant 2026

    Powered by Klaudie.ai

    Back to marketplaceDIGITAL

    ATR Percent

    StrategyQuantIndicators
    ATR Percent

    Expresses Average True Range as a percentage of price, allowing volatility comparison across different instruments. Helps traders adjust position sizes, set stops, and time entries based on current volatility.

    Description

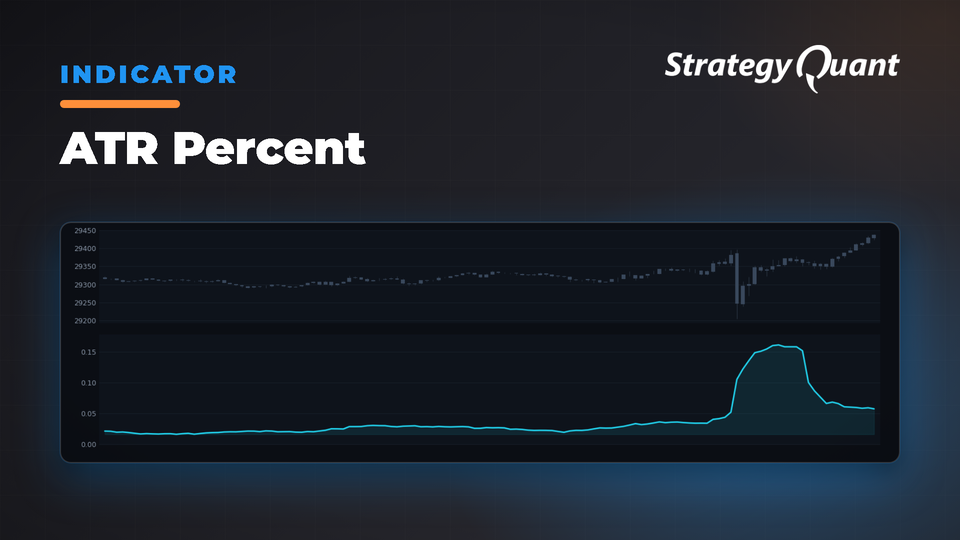
    Average True Range Percent (ATRP) expresses the Average True Range (ATR) indicator as a percentage of a bar’s closing price.

    The Percentage Average True Range (PATR) indicator is a variation of the Average True Range (ATR) indicator that measures the volatility of a financial instrument as a percentage of its price. It is calculated by dividing the ATR by the instrument’s price and then multiplying the result by 100.

    The PATR indicator can be useful for various purposes in trading and investment:

    1. Identifying volatility changes: The PATR indicator allows traders to observe changes in volatility relative to the instrument’s price. An increasing PATR value signifies increasing volatility, while a decreasing PATR value indicates decreasing volatility.
    2. Comparing volatility across instruments: The PATR indicator can be used to compare the volatility of different financial instruments, regardless of their price levels. This helps traders and investors to identify the instruments that suit their risk tolerance and trading style.
    3. Adjusting position sizes: The PATR can be used to adjust position sizes based on the volatility of the instrument. For example, a trader might take smaller positions in instruments with high PATR values (higher volatility) and larger positions in instruments with low PATR values (lower volatility) to manage risk more effectively.
    4. Setting stop-loss and take-profit levels: The PATR indicator can help traders set appropriate stop-loss and take-profit levels based on the instrument’s current volatility. In a high volatility environment, wider stops may be needed to avoid being stopped out prematurely. Conversely, in a low volatility environment, tighter stops can be used to protect profits.
    5. Timing entries and exits: The PATR can be used in conjunction with other technical indicators and price action analysis to identify potential entry and exit points based on the market’s volatility. For instance, traders might look for periods of low PATR values as an opportunity to enter trades, expecting that volatility will eventually increase.
    6. Risk management: By understanding the market’s volatility through the PATR, traders can manage their risk more effectively. They can adjust their position sizes and use appropriate risk management techniques based on the market’s current volatility.

    It’s important to note that the PATR indicator should not be used in isolation but rather in combination with other technical analysis tools and indicators to improve the overall effectiveness of a trading strategy.


    How this indicator works

    • ATRP is used to measure volatility just as the Average True Range (ATR) indicator is. ATRP allows securities to be compared, where ATR does not.
    • ATR measures volatility at an absolute level, meaning lower priced stock will have lower ATR values than higher price stocks. ATRP displays the indicator as a percentage, to allow for securities trading at different prices per share to be compared.


    Calculation

    ATRP = (Average True Range / Close) * 100

    This indicator works for MT4/MT5 Multicharts and Tradestation.

    How to import indicator: https://strategyquant.com/doc/programming-sq/import-export-custom-indicators-and-other-snippets/

    source: https://www.fidelity.com/learning-center/trading-investing/technical-analysis/technical-indicator-guide/atrp

    Past performance is no guarantee of future success. All information should be viewed as educational only UNITED STATES Disclaimer required by Government - Commodity Futures Trading Commission informs: Futures and options trading have great potential rewards, but also great potential risk. You must be aware of the risks and be willing to accept them in order to invest in the futures and options markets. Don't trade with money you can't afford to lose. This is neither a solicitation nor an offer to buy/sell futures, shares or options on the same. No representation is being made that any account will or is likely to realise profits or losses similar to those discussed in this document. The past performance of any trading system or methodology is not necessarily indicative of future results. CFTC RULE 4.41 - HYPOTHETICAL OR SIMULATED PERFORMANCE RESULTS HAVE CERTAIN LIMITATIONS. UNLIKE A RECORD OF ACTUAL PERFORMANCE, SIMULATED RESULTS DO NOT REPRESENT ACTUAL TRADING. ALSO, SINCE THE TRADES WERE NOT EXECUTED, THE RESULTS MAY HAVE OFFSET THE IMPACT, IF ANY, OF CERTAIN MARKET FACTORS, SUCH AS LACK OF LIQUIDITY. SIMULATED TRADING PROGRAMMES IN GENERAL ARE ALSO SUBJECT TO THE FACT THAT THEY ARE DESIGNED WITH THE BENEFIT OF HINDSIGHT. NO REPRESENTATION IS BEING MADE THAT ANY ACCOUNT WILL OR IS LIKELY TO REALISE PROFITS OR LOSSES SIMILAR TO THOSE SHOWN. NO REPRESENTATION IS BEING MADE THAT ANY ACCOUNT WILL, OR IS LIKELY TO, REALISE PROFITS OR LOSSES SIMILAR TO THOSE DISCUSSED WITHIN THIS SITE. IF YOU DECIDE TO INVEST REAL MONEY, ALL TRADING DECISIONS IN THE FINANCIAL MARKETS SHOULD BE YOUR OWN.
    Free

    Files

    • Snippet-ATRPercent.sqm43 KBLocked

    Download unlocks after purchase or with an active tier.

    Details
    Version1.0.0
    PublishedOctober 19, 2026
    Last updatedNovember 2, 2026
    AppSQ
    TypeSnippet
    Authorclonex / Ivan Hudec
    App version145.3058
    Codebase categoryIndicators / Signals