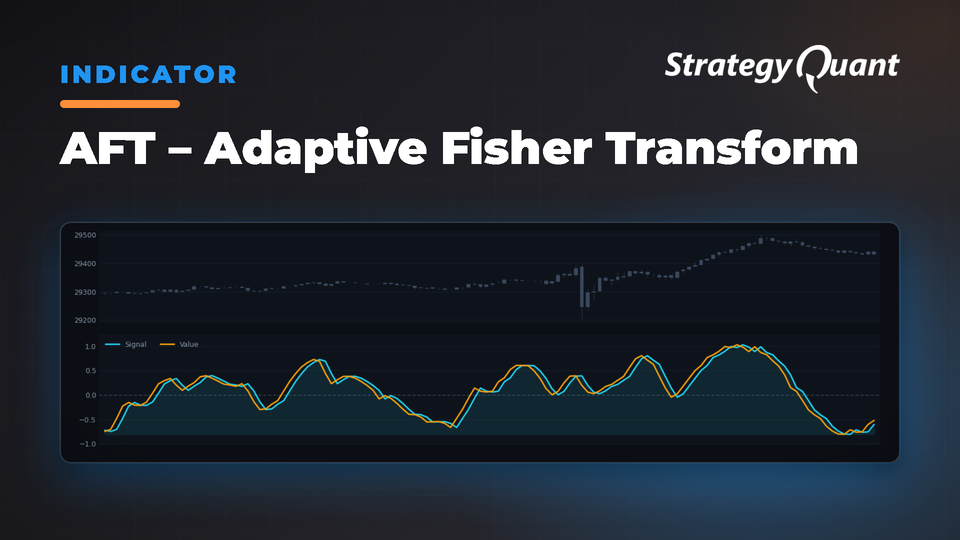
Converts price data to Gaussian distribution with volatility-adaptive periods. Identifies trend changes, reversals, and overbought/oversold levels through Fisher Transform for responsive signal generation.
AFT – Adaptive Fisher Transform
Overview
The Adaptive Fisher Transform (AFT) is an oscillator that converts price data into a Gaussian normal distribution while dynamically adjusting its calculation period based on market volatility.
Key Features
• Volatility-Based Adaptation: Automatically adjusts calculation periods based on market volatility
• Gaussian Distribution: Converts price data into a normal distribution for clearer signals
• Dynamic Period Adjustment: Responds faster during high volatility and smooths during low volatility
• Signal Lines: Provides main Fisher line and signal line for analysis
Mathematical Foundation
The Fisher Transform converts non-normal price distributions into Gaussian distributions using: Fisher = 0.5 × ln((1 + X) / (1 – X)) where X is the normalized price between -1 and +1. Traditional fixed-period indicators are either too responsive during low volatility (false signals) or too slow during high volatility (missed moves). AFT solves this by dynamically adjusting its calculation period.
How AFT Works
1. Price Input: Uses median price (High + Low) / 2
2. Volatility Measurement: Calculates True Range and compares current TR to Average TR
3. Adaptive Period: Adjusts base period using: Period / (1 + AdaptiveFactor × VolatilityRatio), constrained between 3 and 2× base period
4. Price Normalization: Normalizes median price to range [-1, 1] over adaptive period
5. Fisher Transform: Applies Fisher formula to normalized price
6. Smoothing: Uses exponential moving average with adaptive alpha = 2 / (AdaptivePeriod + 1)
7. Signal Generation: Main line = current smoothed Fisher; Signal line = previous Fisher value
Indicator Parameters
Period (Default: 10)
• Range: 3 to 200
• Purpose: Base calculation period before adaptation
• Effect: Shorter = more responsive/noisier; Longer = smoother/slower
AdaptiveFactor (Default: 0.33)
• Range: 0.1 to 1.0
• Purpose: Controls degree of volatility adaptation
• Effect: Lower values (0.1-0.3) = conservative/stable; Higher (0.5-1.0) = aggressive/responsive
Signal Interpretation
Range: -4 to +4 (typical: -2 to +2)
Extreme Readings: Above +2 = strong bullish/overbought; Below -2 = strong bearish/oversold; Above +3 = extremely overbought; Below -3 = extremely oversold
Zero Line: Above 0 = bullish bias; Below 0 = bearish bias; Crossing = potential trend change
Trading Signals
Fisher Line Crossover: Bullish when crossing above 0; Bearish when crossing below 0
Signal Line Crossover: Bullish when Fisher line crosses above Signal line; Bearish when crossing below
Extreme Reversal: Bullish when AFT below -2 and turning upward; Bearish when above +2 and turning downward
Divergence: Bullish divergence = price lower lows while AFT makes higher lows; Bearish divergence = price higher highs while AFT makes lower highs
Practical Applications
Trend Following
• Entry: Fisher line crosses above Signal line + AFT > 0
• Exit: Fisher line crosses below Signal line or AFT < 0
• Filter: Use higher timeframe AFT for trend direction
Mean Reversion
• Long Entry: AFT < -2 and showing upward momentum
• Short Entry: AFT > +2 and showing downward momentum
• Exit: Return to zero or opposite extreme
Divergence Trading
• Setup: Identify divergence between price and AFT
• Entry: Wait for AFT line crossover confirmation
• Stop: Beyond recent swing high/low
Timeframe Applications
• Intraday (1-15 min): Period=10, AdaptiveFactor=0.5 for quick reversals
• Swing Trading (1-4 hrs): Period=14, AdaptiveFactor=0.33 for balanced responsiveness
• Position Trading (Daily/Weekly): Period=20, AdaptiveFactor=0.33 for major reversals
Risk Management
• Position Sizing: Strong signals (extreme + divergence + volume) = larger; Single crossover = smaller
• Stop Loss: Trend following = beyond recent swing; Mean reversion = beyond extreme levels (±3)
• Avoid Trading: AFT oscillating rapidly around zero, adaptive period changing frequently, low volume
• Prefer Trading: Clear extremes (±2+), stable adaptive period, volume confirmation
Parameter Optimization
• Period Range: Test 8-25 for most timeframes
• AdaptiveFactor Range: Test 0.2-0.8 in 0.1 increments
• Market Specific: Different markets may prefer different settings
Conclusion
AFT combines the mathematical rigor of Fisher Transform with volatility-based adaptation for automatic adjustment to changing market conditions.
Indicator Availability: MT4, MT5
Using Custom Blocks: Define your own conditions in StrategyQuant X using Custom Blocks to fine-tune the indicator. Resources:
• StrategyQuant Documentation: Custom Blocks
• StrategyQuant Documentation: Strategy Templates & Custom Blocks
• StrategyQuant YouTube Tutorial: Custom Blocks Overview
Importing Custom Indicators: Import & Export Custom Indicators and Other Snippets
About the author: I'm Ivan Hudec (clonex). I built the free blocks you're using here and write research at algotrading.space. Work with me.